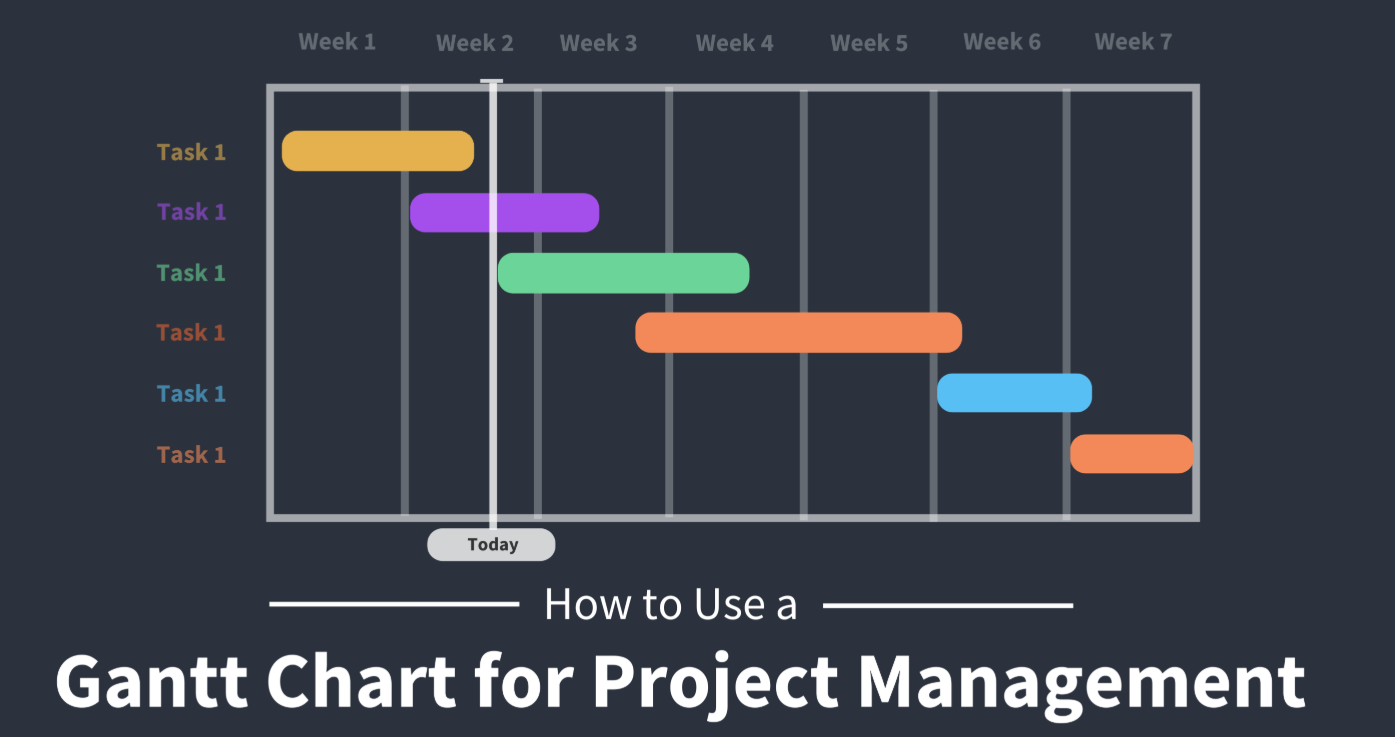
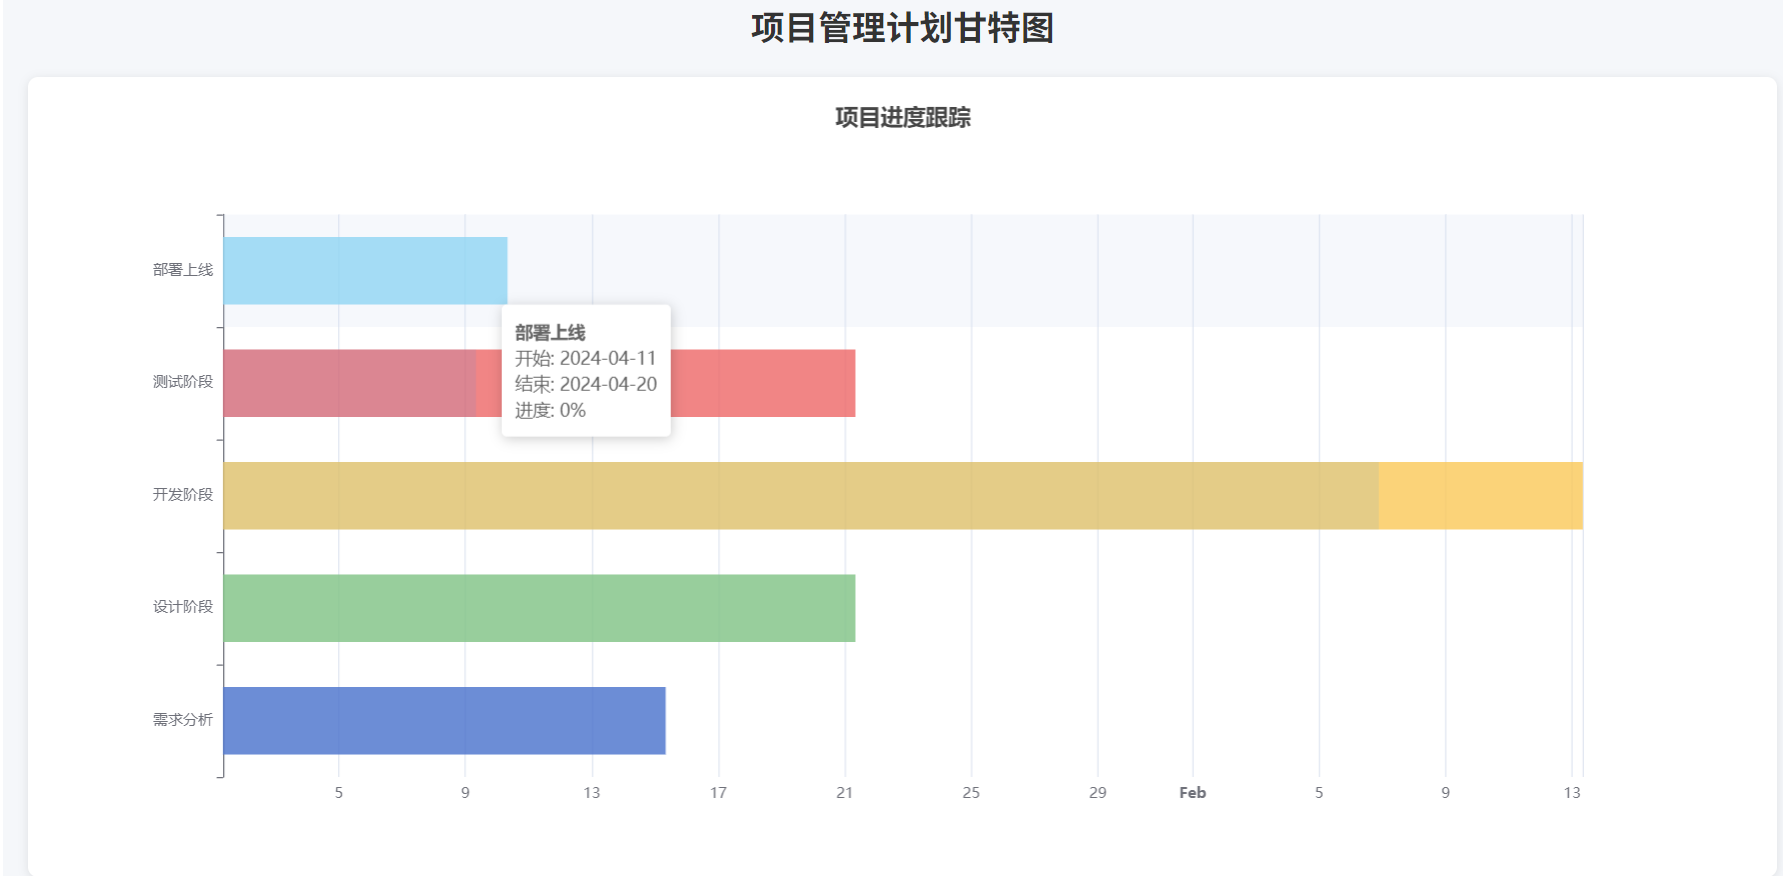
使用 OpenTiny 制作项目管理计划的 甘特图(Gantt Chart),可以通过以下方式实现:
虽然 OpenTiny 官方目前(截至 2025 年)未提供原生的 <tiny-gantt> 甘特图组件,但你可以通过以下 三种推荐方案 实现专业级甘特图功能,结合 OpenTiny 的 UI 组件和生态优势。

✅ 推荐方案一:使用 OpenTiny Chart + ECharts 扩展(推荐 ★★★★★)
OpenTiny 提供了 <tiny-chart> 组件,底层基于 Apache ECharts,而 ECharts 支持通过 自定义系列(custom series)或时间轴图表 实现甘特图效果。
✅ 实现步骤
1. 安装依赖
npm install @opentiny/vue @opentiny/vue-chart
2. 使用 <tiny-chart> 配置甘特图
<template>
  <div class="gantt-container">
    <tiny-chart :options="ganttOptions" />
  </div>
</template>

<script>
import { Chart } from '@opentiny/vue'

export default {
  components: {
    'tiny-chart': Chart
  },
  data() {
    return {
      ganttOptions: {
        title: {
          text: '项目管理甘特图',
          left: 'center'
        },
        tooltip: {
          trigger: 'axis',
          formatter: (params) => {
            const item = params[0]
            return `
              任务:${item.name}<br/>
              开始:${item.value[0]}<br/>
              结束:${item.value[1]}<br/>
              进度:${item.value[2]}%
            `
          }
        },
        grid: {
          left: '10%',
          right: '5%',
          bottom: '10%',
          containLabel: true
        },
        xAxis: {
          type: 'time',
          name: '时间轴'
        },
        yAxis: {
          type: 'category',
          data: ['任务A', '任务B', '任务C', '任务D'],
          name: '任务列表'
        },
        series: [
          {
            name: '任务进度',
            type: 'bar',
            data: [
              { name: '需求分析', value: ['2025-04-01', '2025-04-10', 100] },
              { name: 'UI设计',   value: ['2025-04-08', '2025-04-15', 80] },
              { name: '前端开发', value: ['2025-04-12', '2025-04-25', 50] },
              { name: '后端开发', value: ['2025-04-10', '2025-04-28', 60] }
            ],
            renderItem: (params, api) => {
              const categoryIndex = params.value[3]
              const start = api.coord([api.value(0), categoryIndex])
              const end = api.coord([api.value(1), categoryIndex])
              const height = 20

              return {
                type: 'rect',
                shape: {
                  x: start[0],
                  y: start[1] - height / 2,
                  width: end[0] - start[0],
                  height: height
                },
                style: api.style({
                  fill: '#007aff'
                })
              }
            }
          }
        ]
      }
    }
  }
}
</script>

<style scoped>
.gantt-container {
  width: 100%;
  height: 500px;
  margin: 20px 0;
}
</style>
✅ 优点:
- 与 OpenTiny 无缝集成
- 支持动态数据、交互、缩放
- 可导出图片或打印
- 支持移动端响应式
✅ 推荐方案二:集成第三方甘特图库(如 frappe-gantt 或 tui.gantt)
使用轻量级甘特图库,嵌入到 OpenTiny 的页面布局中。
示例:使用 frappe-gantt(简单易用)
1. 安装
npm install frappe-gantt
2. 在 Vue 中使用
<template>
  <div>
    <h3>项目甘特图</h3>
    <div ref="ganttContainer" class="gantt"></div>
  </div>
</template>

<script>
import 'frappe-gantt/dist/frappe-gantt.css'
import Gantt from 'frappe-gantt'

export default {
  mounted() {
    const tasks = [
      {
        id: 'task1',
        name: '需求分析',
        start: '2025-04-01',
        end: '2025-04-10',
        progress: 100
      },
      {
        id: 'task2',
        name: 'UI设计',
        start: '2025-04-08',
        end: '2025-04-15',
        progress: 80
      },
      {
        id: 'task3',
        name: '开发',
        start: '2025-04-12',
        end: '2025-04-25',
        progress: 50,
        dependencies: 'task2'
      }
    ]

    this.gantt = new Gantt(this.$refs.ganttContainer, tasks, {
      on_click: (task) => {
        alert('点击任务:' + task.name)
      },
      on_date_change: (task, start, end) => {
        console.log('日期变更:', task.name, start, end)
      }
    })
  },
  beforeDestroy() {
    if (this.gantt) this.gantt.clear()
  }
}
</script>

<style scoped>
.gantt {
  width: 100%;
  margin-top: 20px;
}
</style>
✅ 优点:
- 专为甘特图设计,API 简洁
- 支持拖拽、缩放、依赖关系
- 轻量(~50KB)
✅ 推荐方案三:使用 OpenTiny 表格 + 时间轴组件(适合简单展示)
如果只需展示静态计划,可用 <tiny-grid>(表格) + 时间条模拟。
<template>
  <tiny-grid :data="tasks">
    <tiny-grid-column field="name" title="任务"></tiny-grid-column>
    <tiny-grid-column field="dateRange" title="时间">
      <template #default="{ row }">
        <div class="timeline-bar" :style="{ width: row.duration + '%' }">
          {{ row.dateRange }}
        </div>
      </template>
    </tiny-grid-column>
    <tiny-grid-column field="progress" title="进度">
      <template #default="{ row }">
        <tiny-progress :percentage="row.progress" :text-inside="true" :stroke-width="20" />
      </tiny-progress>
    </tiny-grid-column>
  </tiny-grid>
</template>

<script>
import { Grid, GridColumn, Progress } from '@opentiny/vue'

export default {
  components: {
    'tiny-grid': Grid,
    'tiny-grid-column': GridColumn,
    'tiny-progress': Progress
  },
  data() {
    return {
      tasks: [
        { name: '需求分析', dateRange: '4/1 - 4/10', duration: 30, progress: 100 },
        { name: 'UI设计',   dateRange: '4/8 - 4/15', duration: 25, progress: 80 },
        { name: '开发',     dateRange: '4/12 - 4/25', duration: 40, progress: 50 }
      ]
    }
  }
}
</script>

<style scoped>
.timeline-bar {
  background: linear-gradient(90deg, #007aff, #40a9ff);
  color: white;
  padding: 5px 10px;
  border-radius: 4px;
  text-align: center;
  font-size: 12px;
}
</style>
✅ 适用场景:
- 简单项目展示
- 无需交互操作
- 快速原型

🎯 OpenTiny 甘特图实现总结
| 方案 | 是否推荐 | 适用场景 |
|---|---|---|
| OpenTiny Chart + ECharts | ✅✅✅✅✅ | 企业级项目,需高度定制、交互、数据驱动 |
| 集成 frappe-gantt / tui.gantt | ✅✅✅✅ | 需要专业甘特图功能(拖拽、依赖、缩放) |
| OpenTiny 表格 + 进度条 | ✅✅ | 简单展示,无需复杂交互 |
💡 增强建议(结合 OpenTiny 其他组件)
| 功能 | 实现方式 |
|---|---|
| 添加任务 | 使用 <tiny-button> + <tiny-modal> 弹窗表单 |
| 编辑任务 | 点击图表触发模态框,更新数据 |
| 筛选/搜索 | 使用 <tiny-input> + <tiny-select> 过滤任务 |
| 导出计划 | 使用 <tiny-button> 调用 ECharts 导出 API |
| 权限控制 | 结合角色判断是否显示“编辑”按钮 |

✅ 最终建议
如果你正在使用 OpenTiny 构建 企业级项目管理系统,推荐:
方案一:
<tiny-chart>+ ECharts 自定义甘特图
它能与 OpenTiny 的 UI 风格统一,支持响应式、主题切换、动态数据,是最契合 OpenTiny 生态的解决方案。
你也可以关注 OpenTiny 官方是否未来推出原生甘特图组件(可能性高)。


 656
656

 被折叠的 条评论
为什么被折叠?


