


 本文介绍了一款设想中的Visual Studio 2010概念IDE,包含多种创新功能如智能代码导航、可视化调试等,旨在提升开发效率。
Overview
I. Code
Click here to view the article with full size images.
Like a concept car strutting its stuff, the Visual Studio 2010 Concept IDE is packed with over-the-top features and weird ideas. Tame as it may look, this UI designed for one thing: jamming out code. Save the bizarre Windows Media-esque skins for the punks, we’ve got work to do.
Here it is:

Concept One: The Solution Explorer (green box)

The green box at top left clearly identifies the name of the solution and provides two nice summary stats: total type count and total source line count.
Click the green arrow to slide out a panel providing full configuration options for the solution.

Concept Two: Assembler (yellow box)
Add, remove or build assemblies from the Assembler. Display assemblies in alphabetical or build order. Build individual assemblies by clicking the build number on the right. The shaded circles indicate the number of code files in the assembly - with darker colors indicating a greater number of files.

Click the yellow arrow to slide out a panel replete with assembly configuration dream tools.

Concept Three: CodeFile Crawler (blue box)

You’ve got exactly one jillion code files in your assembly, right? Use the Crawler to find the one you need to work on next. Search by type, type name, namespace or use the root feature to select a root type - the Crawler will then find all referenced types down to level zero. If that’s too many types, use the Level Cutter to limit the results to a given level.
Concept Four: Head (color-coded area above the editor)

After you select a type in the Crawler, the type name and relevant stats are displayed in the Head. Of course, the stats update as you code.
Concept Five: Remoting Eye (large circular icon in the head)
![]()
Of course you’re pair programming – the eye tells you so. Whenever the eye is displayed, your programming partner’s computer is connected to the session. Click the eye and select “Pass The Baton” to send a current copy, the diffs, or checkout the same files from your partner's computer (whatever your version control system wants to do) and then switch your UI into remote mode.
Concept Six: Click Strip (directly above of the editor)
![]()
All types referenced by the currently selected type are displayed in the strip, just click them to view the code file for that type.
Concept Seven: Ashes (gray box)

On the right, the code files which have been selected in the past, along with summary stats indicating the amount of work done on each are listed. Enter the first few letters of a code file into the Filter box at the top to jump to an entry.
Concept Eight: Floating Run Button

Vertically centered to the right of the method in which the caret is currently positioned is the floating run button. It builds and runs the application (just like F5).
Concept Nine: Floating Search and Replace

The giant magnifying glass at the top corner of the editor indicates that the poor man’s refactoring tool is within easy reach. Yes it does all the standard search and replace stuff.
Concept Ten: Greenboard

The Greenboard is a popup window displayed when the floating run button is clicked. Each assembly to be built is accompanied by a bar graph, proportionally sized based on the amount of source in the assembly. Error messages are collected at the bottom of the board. If an assembly fails to build, the Greenboard automatically closes and the Error Trap is displayed.
Concept Eleven: Error Trap
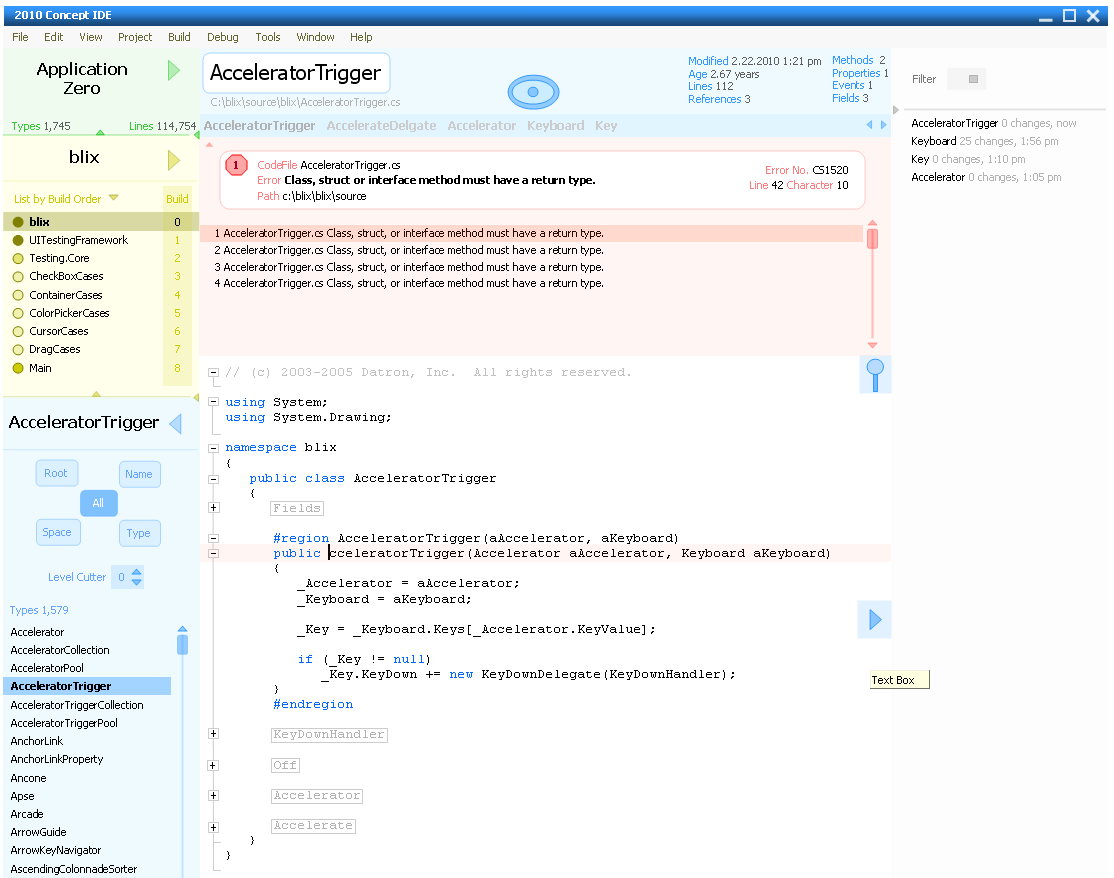
The ErrorTrap appears when compilation fails. It makes for clear, quick identification of errors.
II. Debug
Click here to view the article with full size images.
In this second part of the Visual Studio 2010 Concept IDE article, we address debugging. Before we get started, let’s first use the shuttering system in the Concept IDE to make code king. Here all shutters have been collapsed, maximizing the code editor:

Concept Twelve: Visual Breakpoint Conditions
Breakpoint conditions can now be entered directly into the editor, just click the small red arrow labeled “Condition” to slide out a panel below the breakpoint and code away. Conditions are persistent, that is, as long as the line of source where the breakpoint is defined exists, the condition for that line is remembered thereafter.

Concept Thirteen: Stepper
Hovering over the all-important line of code currently executing is the Stepper. This little navigator makes it easy to Step Into, Step Over or Step Out. It also enumerates the various property getters poised for resolution as of the current line. You can easily skip over these on your way into the method of interest, or step into them by clicking in the Stepper. Getters which contain anything beyond a simple return of a field value are marked with a special icon.

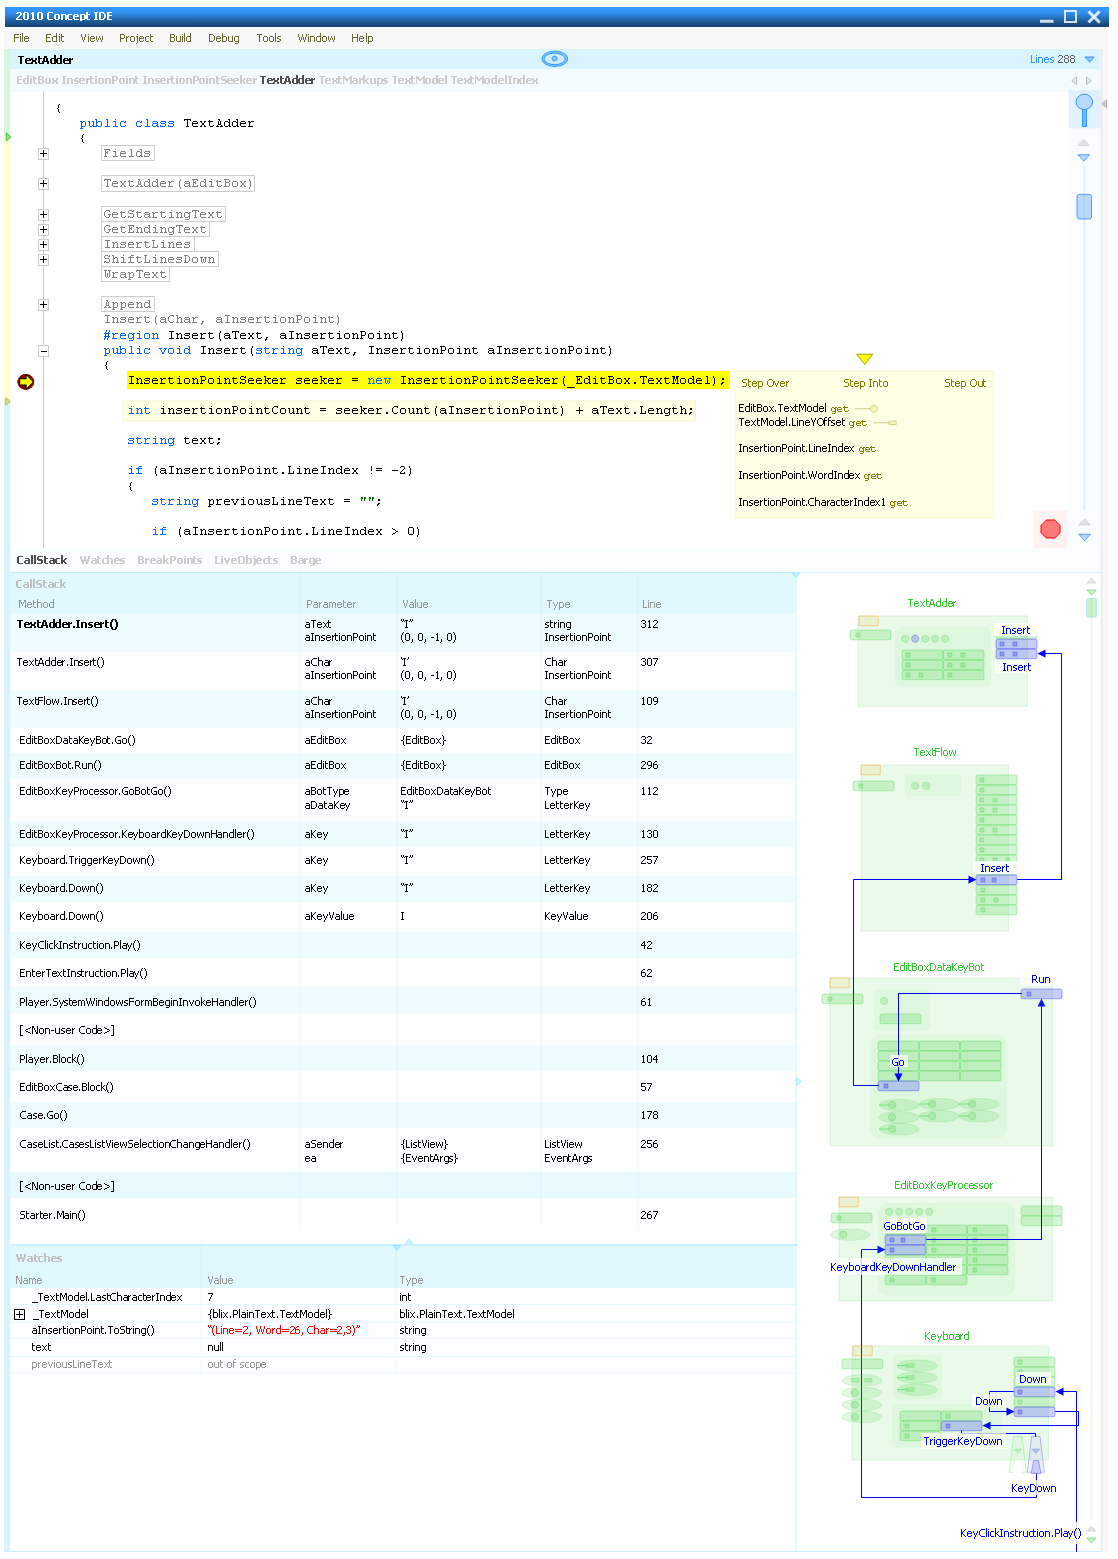
Concept Fourteen: Minis
These generated diagrams form a map of the running application. See which objects are instantiated, which methods have been called and easily inspect object values. Minis, and the standards by which they are generated are discussed in detail here.

Concept Fifteen: Visual Stack
Minis give us the opportunity to present the stack as a diagram, with certain methods, property getters/setters or interface implementations “lit up” to show that they are currently receiving attention from the CPU. Click anywhere in the Mini and the source for that member is displayed in the Code Editor. Create Watch values by dragging from the Mini to the Watch window.
Concept Sixteen: Object Dash
Click the small orange square at the top left of a Mini to display the Object Dash. This small watch window defaults to the field values in the object, but can be customized with code-based watches. The default values can be quickly removed by clicking the checkboxes on the left. Once you customize an Object Dash, those customizations are remembered per type. Object Dashes can also be launched from anywhere in the Debug UI where an object reference is displayed (for example the Call Stack, the Watch window, or the Code Editor itself) by placing your mouse over the reference and clicking Ctrl-Shift-O.

Concept Seventeen: LiveObjects
When the debugger hits a breakpoint, use the LiveObjects panel to view the currently existing objects.

Concept Eighteen: The Barge
The Barge is a list of all objects which have been garbage collected, including the amount of memory reclaimed. Reduce the noise in this list by right-clicking and filtering out delegates, attributes, collections or the descendants of any type.

Concept Nineteen: Origins
It’s definitely great to know which objects currently exist (LiveObjects) or have existed (the Barge). When the object counts look wrong and you need to know the methods where these objects were created, check the Origins panel. Double-click the method to display the source in the code editor.

Concept Twenty: Trax
From the moment you hit the floating run button, to the moment you shut down the application, the lines of code executed and the amount of CPU time consumed by each is tracked. Use the Trax Summary to locate the most time intensive or noisy methods. Select a method in the Summary and the SubTracker will show all time-intensive calls in that method. Click one of these calls in the SubTracker or the “bullet” in the Code Editor to continue drilling down. Trax also highlights each line of source that executed during the last run, making it easy to differentiate which lines executed from those lines which did not.

Your Turn
And that’s it. What about the Visual Forms Designer, Refactoring, UML, Tests, and that AI Buddy who codes everything for me? Won’t these gizmos be in there by 2010? Well, that’s where you come in. Suggest ways of bringing this UI forward even further, and we will incorporate the best in revisions of this article!
The Concepts Behind The Concept IDE
Edward R. Tuft-esque ideas in this IDE are:
The “look” of this IDE was inspired by the works of Edward R. Tufte. The editing area is white, drawing your attention to the focus of your work: the code. Color coding on the left divides the major areas, and clearly identifies them in the Head when they are selected (i.e. when the giant arrow is clicked.) Any name created by you is displayed in black. Any name which is part of the IDE is deemphasized. “Hard” separator lines have been avoided.
Alan Cooper-esque ideas in this IDE are:
Solid-State
Everything is saved, including the undo stacks of all code files, the last type selected, the ashes list, etc. Whether you unplug your computer from the wall, or orchestrate a nice agreeable Start | Turn Off sequence, the IDE looks exactly the same the next time you launch it.
Sovereign App
Designed to be maximized and used for hours at a time, this UI has understated controls and provides no distracting 3-D effects, save hot controls, which draw in an XP style when the mouse is over them. Affordance is provided through cursor hinting and hot control effects; expert users can “discover” functions as they go.
Putting Will Over Might
The jillion things a developer might want to do in the IDE have been relegated to dialogs and the menu. The few things that a developer will definitely need to do every day (or every minute) have been placed front center.


 被折叠的 条评论
为什么被折叠?
被折叠的 条评论
为什么被折叠?
 到【灌水乐园】发言


