


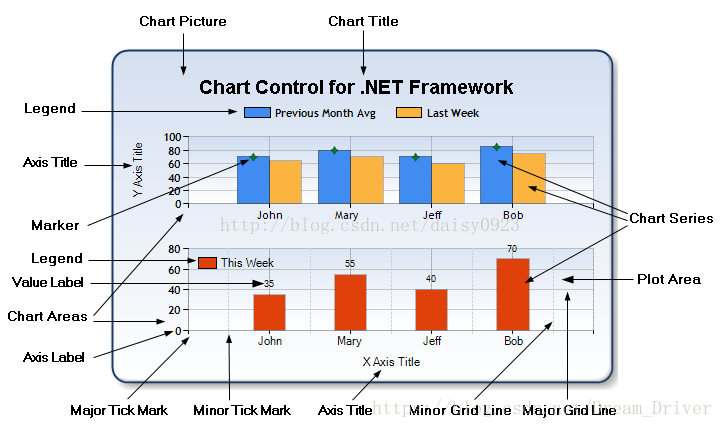
1、关于chart图表的各项参数说明
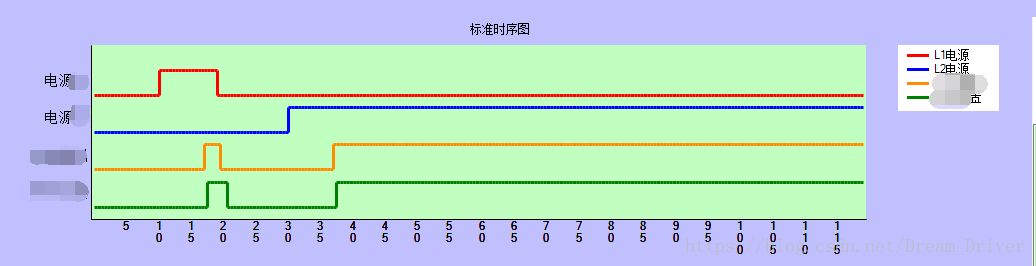
2、本人用chart做的图片截图,有四个serial
3.代码,注意:txData_L1,tyData_L1是一对数组,长度一致即可
例如:List<int> txData_L1 = new List<int>() {1,2,3,4,5 };
List<int> tyData_L1 = new List<int>() {4,5,4,6,6 };
chart表中serial【0】的初始化,其余相同
//背景
chart1.ChartAreas[0].Axes[0].MajorGrid.Enabled = false; //X轴上网格
chart1.ChartAreas[0].Axes[1].MajorGrid.Enabled = false; //y轴上网格
chart1.ChartAreas[0].Axes[0].MajorGrid.LineDashStyle = ChartDashStyle.Dash; //网格类型 短横线
chart1.ChartAreas[0].Axes[0].MajorGrid.LineColor = Color.Gray;
chart1.ChartAreas[0].Axes[0].MajorTickMark.Enabled = false; // x轴上突出的小点
chart1.ChartAreas[0].Axes[1].MajorTickMark.Enabled = false; //
chart1.ChartAreas[0].Axes[1].IsInterlaced = false; //显示交错带
chart1.ChartAreas[0].Axes[0].LabelStyle.Format = "#"; //设置X轴显示样式
//chart1.ChartAreas[0].Axes[1].LabelStyle.Format = " "; // 设置Y轴不显示
chart1.ChartAreas[0].Axes[1].MajorGrid.LineDashStyle = ChartDashStyle.Dash; //网格类型 短横线
chart1.ChartAreas[0].Axes[1].MajorGrid.LineColor = Color.Gray;
chart1.ChartAreas[0].AxisY.CustomLabels.Add(1, 3, "开关");
chart1.ChartAreas[0].AxisY.CustomLabels.Add(4, 6, "输出");
chart1.ChartAreas[0].AxisY.CustomLabels.Add(7, 9, "电源");chart1.ChartAreas[0].AxisY.CustomLabels.Add(10,12, "电源");
for (int i = 1; i < txData_L1.Count() / 5 + 1; i++)
{
chart1.ChartAreas[0].AxisX.CustomLabels.Add(10*i, 10*i+2, Convert.ToString(i*5));
}
//chart1.ChartAreas[0].AxisX.Interval = 0.5;
//chart1.ChartAreas[0].AxisY.Name.
//chart1.ChartAreas[0].Axes[1].AxisName = "456";
//图表数据区,有多个重叠则循环添加
//chart1.Series.Add(new Series()); //添加一个图表序列
//chart1.Series[0].XValueType = ChartValueType.String; //设置X轴上的值类型
chart1.Series[0].ChartType = SeriesChartType.StepLine; //图类型(折线)
chart1.Series[0].Points.DataBindXY(txData_L1, tyData_L1); //添加数据
//折线段配置
chart1.Series[0].Color = Color.Red; //线条颜色
chart1.Series[0].BorderWidth = 3; //线条粗细
chart1.Series[0].MarkerBorderColor = Color.Red; //标记点边框颜色
chart1.Series[0].MarkerBorderWidth = 3; //标记点边框大小
chart1.Series[0].MarkerColor = Color.Red; //标记点中心颜色
chart1.Series[0].MarkerSize = 5; //标记点大小


 3万+
3万+


 被折叠的 条评论
为什么被折叠?
被折叠的 条评论
为什么被折叠?
 到【灌水乐园】发言


