


前段时间公司有一个比较重要的模块从 vue2 升级到 vue3,升级后发现 element-plus table 的性能相比 vue2 版本下降非常严重。
自定义列全部勾选的场景下(20 行 x 180 列),列表中的开关切换,耗时从原先的 400-500 毫秒下降到 7-8 秒,严重影响用户体验,经过较长时间的性能测试、debug,找到了几处比较核心的优化点。
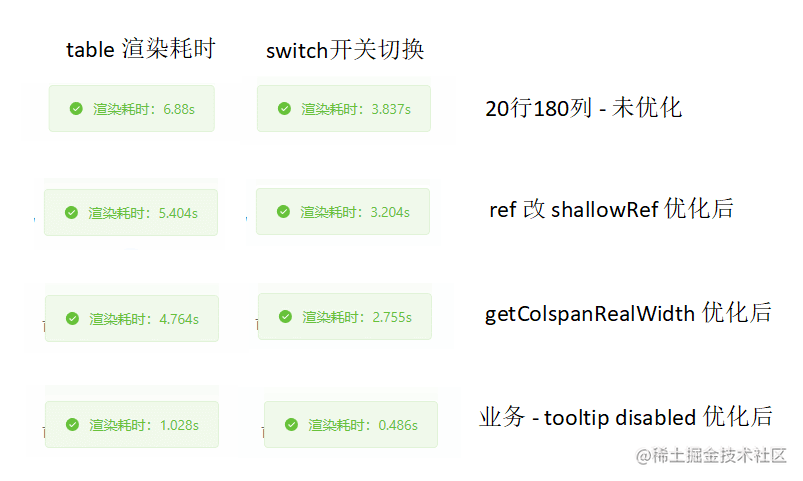
先来看一下 20 行 x 180 列场景下各个优化点的性能测试数据,为排除偶然性,每个场景都会测 3 次。
| 优化类型 | table 整体渲染耗时 | switch 切换耗时 |
|---|---|---|
| 未优化前 | 6.59s(6.71s、6.49s、6.577s) | 3.982s(3.966s、3.947s、4.033s) |
| data 与 columns 从 ref 改 shallowRef 后(耗时减少 17-20%) | 5.18s(5.063s、5.104s、5.363s) | 3.3s(3.175s、3.029s、3.122s) |
| getColspanRealWidth 优化后(耗时减少 7-20%) | 4.843(4.728s、4.703s 、5.098s) | 2.65s(2.636s、2.645s、2.671s) |
| 业务优化 去除tooltip disabled属性后(耗时减少 80%) | 1.008s(1.032s、0.997s、0.994s) | 0.514s(0.517s、0.53s、0.495s) |
大致优化内容如下
修改 table 源码,将 data 与 columns 从 ref 改为 shallowRef。
修改 table 源码,getColspanRealWidth 函数中响应式数据优化。
业务优化:去掉 el-tooltip disabled 属性,改为 if。
准备工作
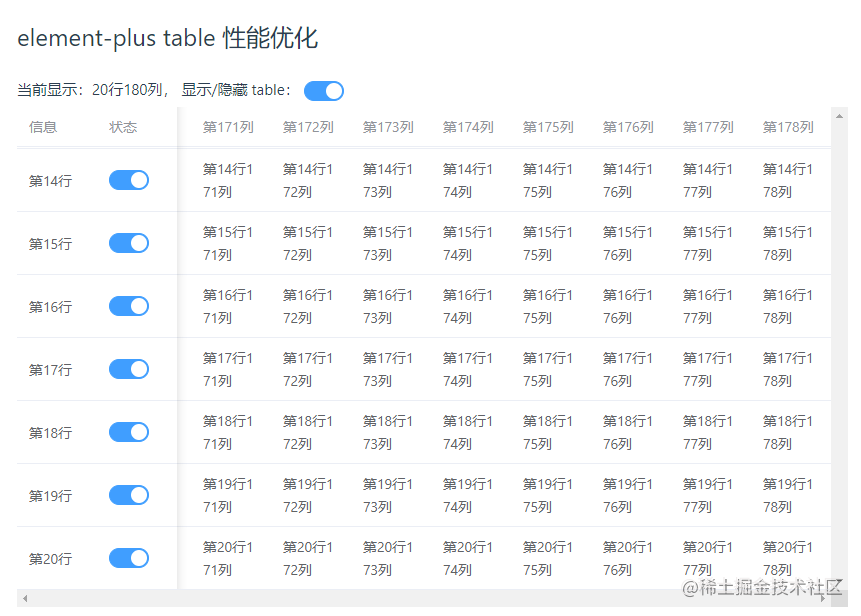
首先初始化一个 vue3 项目,引入 element-plus,并使用 el-table 实现一个 20 行 * 180 列表格。
20 行 + 180 列:2 个固定列(一个文本、一个 switch),178 个通过 for 循环创建的自定义列
一个显示/隐藏 table 的 switch 开关,用于测试 table 从隐藏到显示,渲染耗时
自定义列中有一个 el-tooltip + disabled 逻辑
最小化业务 demo 创建
核心 table 代码代码如下,完整代码参见:table-base | table-performance-demo[1]
<el-table
  v-if="showTable"
  :data="tableData"
  style="width: 100%; height: 500px; overflow: scroll"
>
  <el-table-column prop="info" label="信息" width="80" fixed />
  <el-table-column prop="status" label="状态" width="80" fixed>
    <template #default="scope">
      <el-switch v-model="scope.row.status" @change="statusChange" />
    </template>
  </el-table-column>
  <el-table-column
    v-for="item in customColumns"
    :key="item.prop"
    :prop="item.prop"
    :label="item.label"
  >
    <template #default="scope">
      <el-tooltip
        placement="top-start"
        :disabled="!(item.prop === 'column1' && scope.row[item.prop])"
      >
        <template #content>
          <span>{{ "tooltip显示" + scope.row[item.prop] }}</span>
        </template>
        <span>{{ scope.row[item.prop] }}</span>
      </el-tooltip>
    </template>
  </el-table-column>
</el-table>

<script lang="ts" setup>
// 假数据逻辑
const customColCount = 178; // 自定义列数
const rowCount = 20; // 行数
onBeforeMount(() => {
  // 初始化自定义列数据
  let temp = [];
  for (let i = 0; i < customColCount; i++) {
    temp.push({ prop: `column${i + 1}`, label: `第${i + 1}列` });
  }
  customColumns.value = temp;

  // 初始化表格数据
  let dataTemp = [];
  for (let i = 0; i < rowCount; i++) {
    let row: any = { info: `第${i + 1}行`, status: true };
    i === 0 && (row.status = false);
    for (let j = 0; j < customColCount + 2; j++) {
      row[`column${j + 1}`] = `第${i + 1}行${j + 1}列`;
    }
    dataTemp.push(row);
  }
  tableData.value = dataTemp;
});
</script>
渲染耗时计算逻辑
渲染耗时计算逻辑如下,利用 script 阻塞,来计算渲染耗时
/*
<div v-loading="showLoading" element-loading-text="数据加载中...">
  <p>
    当前显示:{{ `${rowCount}行${customColCount + 2}列` }}, 显示/隐藏 table:
    <el-switch :model-value="showTable" @click="switchTableShow"></el-switch>
  </p>
  <el-table v-if="showTable"> .... </el-table>
</div>
*/

// 显示/隐藏 table,计算 table 渲染耗时
const switchTableShow = () => {
  // 先展示 loading
  showLoading.value = true;

  // 200ms 后再修改 table 是否显示,防止和 loading 合并到一个渲染周期,导致 loading 不显示
  setTimeout(() => {
    let startTime = +new Date();
    showTable.value = !showTable.value; // 修改 table 显示,会形成 script 阻塞
    showLoading.value = false; // 这里的 loading 关闭,会在 table 阻塞完成后渲染关闭 dom
    // 创建一个宏任务,等上面阻塞的微任务执行完成后,再显示计算耗时
    setTimeout(() => {
      let endTime = +new Date();
      ElMessage.success(`渲染耗时:${(endTime - startTime) / 1000}s`);
    }, 0);
  }, 200);
};
性能数据,与 performance 耗时对比
table 渲染、switch 切换测试耗时如下

table 隐藏到显示 gif 图

switch 从关到开 gif 图
为了验证我们自己写的耗时测试数据的准确性,这里在 switch 开关时,打开了 performance 录制,具体如下图
页面显示渲染耗时:4.524s,performance 中两个 Long Task:2.29s + 2.17,加上非 Long Task 部分,数据基本一致,因此我们自己写的耗时计算逻辑是基本准确的
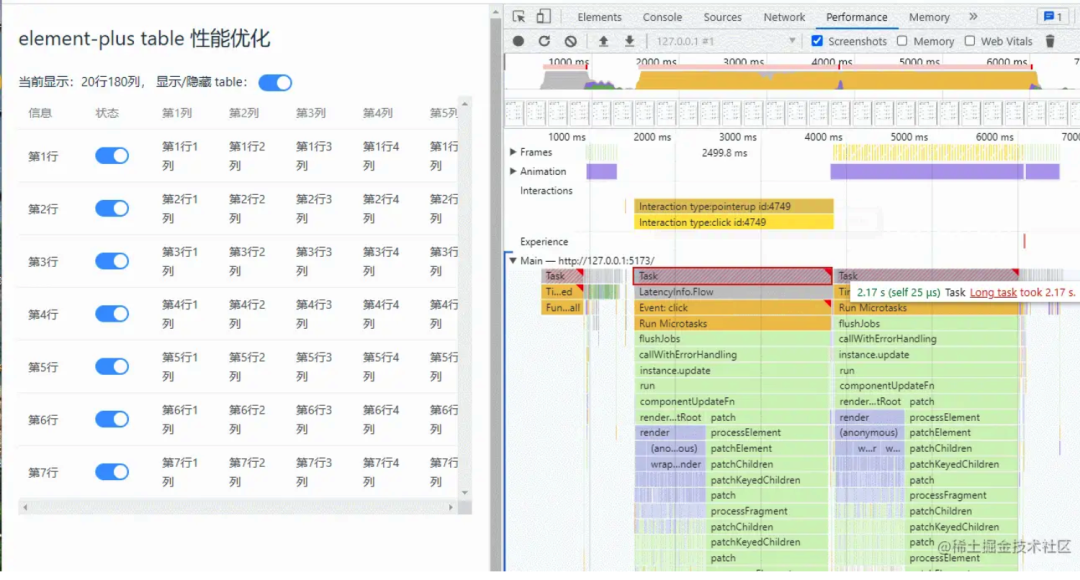 table-base-switch-performance.gif
另外,开启 performance 录制时,比不录制时要稍微慢点。下面来开始优化吧!
ref 改 shallowRef
理论依据与可行性分析
列表中的开关切换时,table 虽然只是一个节点发生了变化,但依旧触发了完整的 vue patch 比对更新逻辑,耗时较久。
来看一个官方的解释:渲染机制 | Vue.js[2]

理论上,减少响应式数据依赖,就可以提升性能。
shallowRef() 是 ref() 的浅层作用形式。仅当 xx.value 发生变更时,才触发响应更新,减少深层次的响应依赖,可以提升 patch 比对性能。参考 指南 - 减少大型不可变结构的响应性开销[3]
const state = shallowRef({ count: 1 })

// shallowRef 不会触发更改,如果 state 为 ref 时,是可以触发更新的。
state.value.count = 2

// shallowRef 会触发更改
state.value = { count: 2 }
这里主要修改两种数据从 ref 到 shallowRef
// src/table/src/store/watcher.ts
function useWatcher<T>() {
  const data: Ref<T[]> = shallowRef([]); // table data 数据
  const columns: Ref<TableColumnCtx<T>[]> = shallowRef([]); // 列数据
  // ...
}
这里有个问题,把 data、columns 改为 shallowRef 对功能会不会有影响?
首选,每次列表数据更新,我们业务逻辑都会去请求列表,设置 list.value = xxx 可以触发 shallowRef 更新。
经过测试,就算是 switch 开关 v-model 绑定的 scope.row.status 变更也可以正常更新。
手动点击测试选中、排序、分页等均未发现异常。
基于以上三点,在我们业务中,这个修改是可行的。提醒:如果想在你自己的项目中使用该优化,需要先做好测试。
下面来看具体修改细节
拷贝 element-plus table 源码到当前项目
当前最新的版本是 2.2.8,打开 element-plus/releases[4],下载最新版本代码,将 table 目录(element-plus-2.2.28/packages/components/table) copy 到项目中的 src/table 下,删除目中无用的 __test__ 测试目录
新开一个路由,/new 指定到一个新增的 table 组件内,相比原先 table 组件,只增加一行代码,当前组件内使用我们自定义修改的 table。完整代码参见:2-table-use-source | table-performance-demo[5]
import ElTable from "@/table/src/table.vue";
引入后报错 [plugin:vite:import-analysis] Failed to resolve import "@element-plus/directives" from "src\table\src\table.vue". Does the file exist?
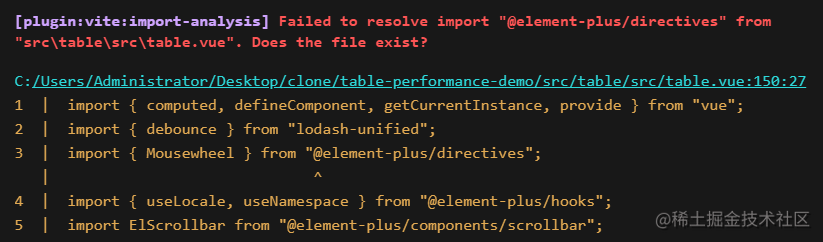
做一些修改,让代码可以在我们自己的项目中跑起来,方便修改、调试源码
在 table 目录中搜索 @element-plus 相关关键字,并进行批量替换
// @element-plus/directives => element-plus/es/directives/index
// @element-plus/hooks => element-plus/es/hooks/index
// @element-plus/utils => element-plus/es/utils/index
搜索
@element-plus/components改为直接从 'element-plus' 引入
// 比如:
import ElCheckbox from '@element-plus/components/checkbox'
// 改为
import { ElCheckbox } from 'element-plus'

// 注意:资源类的可以不用改,比如 import "@element-plus/components/base/style/css";
修改源码 - ref 改 shallowRef
在 src/table/src/store/watcher.ts 中,将 data 和 columns 数据从 ref 改为 shallowRef,具体代码参:table-ref-shallowRef | table-performance-demo[6]
// src/table/src/store/watcher.ts
function useWatcher<T>() {
  const data: Ref<T[]> = shallowRef([]);
  const _data: Ref<T[]> = shallowRef([]);
  const _columns: Ref<TableColumnCtx<T>[]> = shallowRef([]);
  const columns: Ref<TableColumnCtx<T>[]> = shallowRef([]);
  // ...
}
另外在 中 表格前面增加下面一行,标记调用的是我们修改的 table 组件
<!-- src/table/src/table.vue 表格顶部增加下面一行 --->
<p style="color: red">来自 table 源码</p>
<!-- 内部逻辑 -->
<div :class="ns.e('inner-wrapper')" :style="tableInnerStyle">
    <!-- ... -->
</div>
性能数据(耗时减少17-20%)
table 渲染、switch 切换测试耗时如下

table 隐藏到显示 gif 图

switch 从关到开 gif 图
getColspanRealWidth 优化
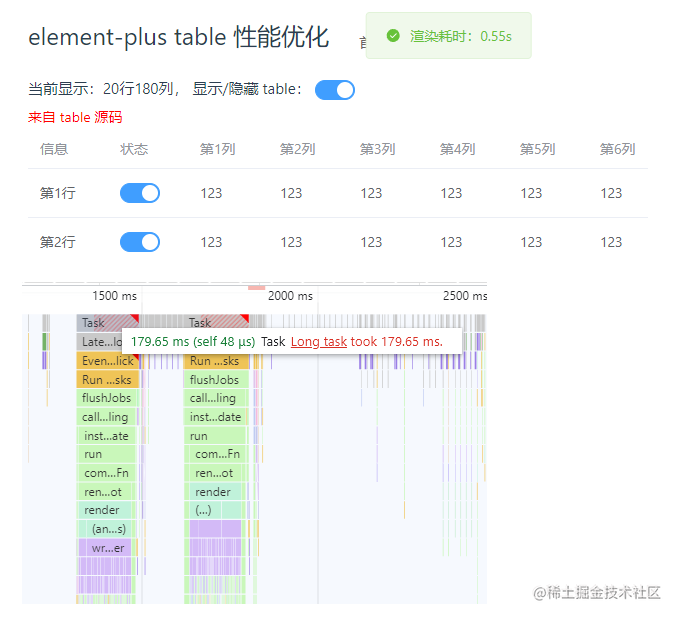
当页面卡顿时,可以通过 performance 测试性能。下图是点击 switch 开关后的性能数据。可以看到
有两个 Scripting 阻塞 longTask,1.89s + 1.73s,整体耗时 3.62s (performance开启时,会变慢一点)
主要有两种耗时任务:紫色小块是 render 渲染耗时、绿色小块是 patch 比对耗时,一般 patch 是 vue 内部逻辑,比较难优化
通过查看 render 相关耗时,找到 getColspanRealWidth 耗时 212.2ms,这里有优化的空间
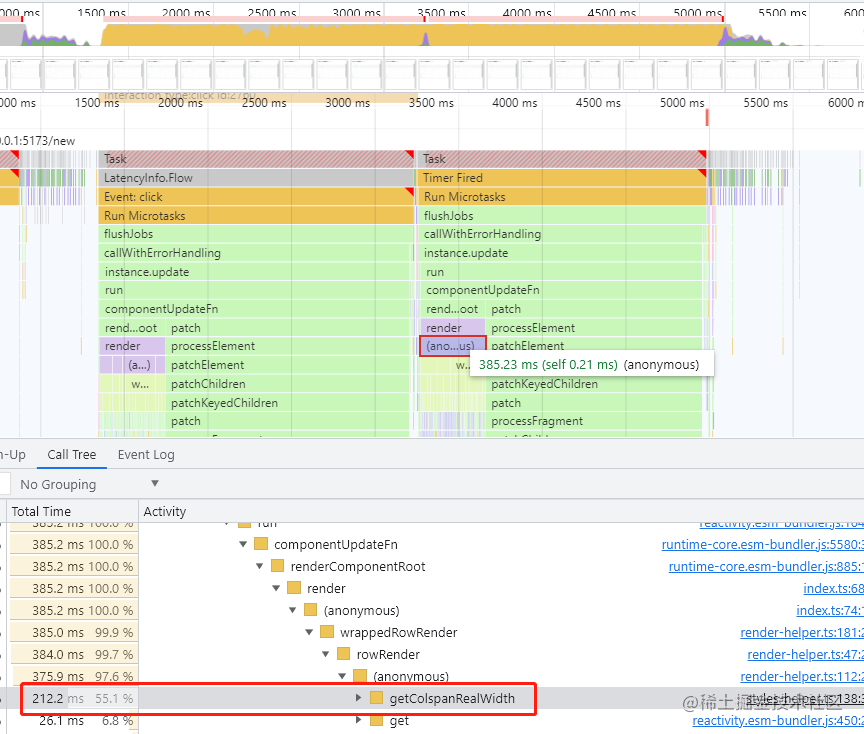
我们来查看这个函数耗时的原因,主要是在 tr 渲染时调用该函数,计算每列的宽度
// src\table\src\table-body\render-helper.ts
columns.value.map((column, cellIndex) => {
  // ...
  columnData.realWidth = getColspanRealWidth(
    columns.value,
    colspan,
    cellIndex
  );
  // ...
})
具体实现如下,只用到了 realWidth, width 属性,且 columns.value 是响应式依赖,可以修改为非响应式数据,看是否能减少耗时。
// src\table\src\table-body\styles-helper.ts
const getColspanRealWidth = (
  columns: TableColumnCtx<T>[],
  colspan: number,
  index: number
): number => {
  if (colspan < 1) {
    return columns[index].realWidth
  }
  const widthArr = columns
    .map(({ realWidth, width }) => realWidth || width)
    .slice(index, index + colspan)
  return Number(
    widthArr.reduce((acc, width) => Number(acc) + Number(width), -1)
  )
}
这里我们新建 optimizeColumns 变量,存储函数中使用的 realWidth 和 width,将这个非响应式数据传入到 getColspanRealWidth 函数内部使用,完整代码参见 getColspanRealWidth-optimize | table-performance-demo[7]
// src\table\src\table-body\render-helper.ts
const optimizeColumns = columns.value.map((item) => {
  return { realWidth: item.realWidth, width: item.width };
});
columns.value.map((column, cellIndex) => {
  // ...
  columnData.realWidth = getColspanRealWidth(
    optimizeColumns, // 传入函数内部时,使用非响应式数据
    colspan,
    cellIndex
  );
  // ...
})
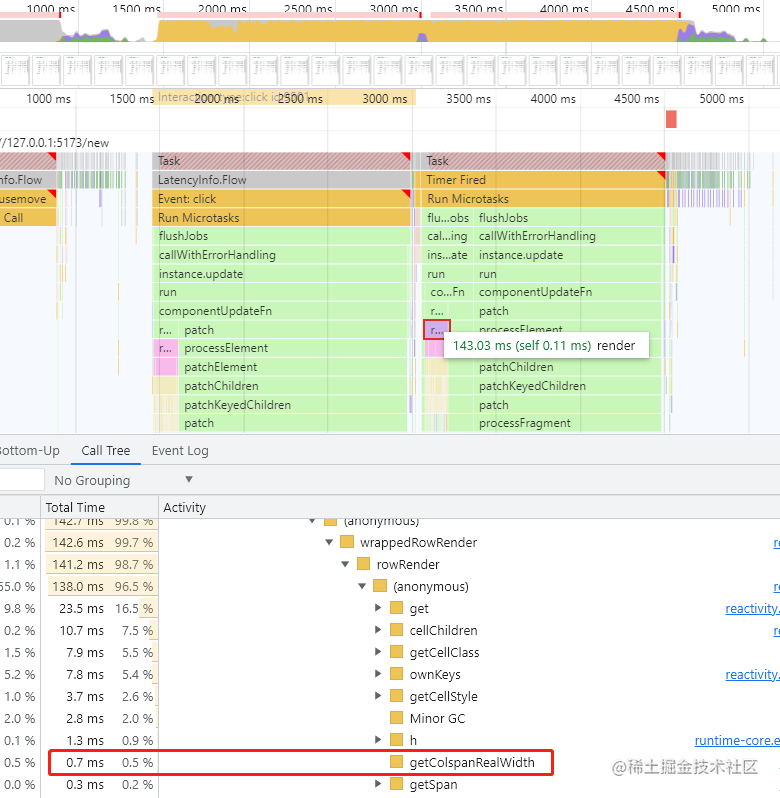
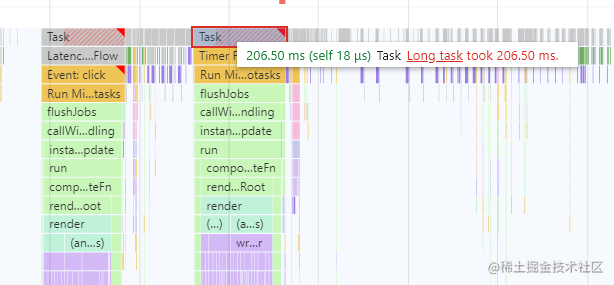
耗时从 200ms 下降到 0.7ms
修改好后再次测试性能,惊喜的发现,这个函数的耗时从 200ms+ 下降到 1ms 内,render 性能明显提升。1.54s + 1.45s = 2.99s
性能数据(耗时减少7-20%)
table 渲染、switch 切换测试耗时如下

table 隐藏到显示 gif 图
switch 从关到开 gif 图
业务优化 tooltip disabled 改 if
经过上面的优化后,我们意识到,即使是很细微的响应式数据优化,也会对性能带来较大影响。那业务逻辑中是否也存在这样的数据呢?
于是采用注释 + 将 el-table-column 插槽换成静态节点 <span>123</span> 的方法,测试具体是哪里耗时较长,然后针对性优化。
经过测试,发现将自定义列中的 el-tooltip 换成静态节点后,性能有极大提升。
<el-table-column
  v-for="item in customColumns"
  :key="item.prop"
  :prop="item.prop"
  :label="item.label"
>
  <template #default="scope">
    <!-- <el-tooltip
      placement="top-start"
      :disabled="!(item.prop === 'column1' && scope.row[item.prop])"
    >
      <template #content>
        <span>{{ "tooltip显示" + scope.row[item.prop] }}</span>
      </template>
      <span>{{ scope.row[item.prop] }}</span>
    </el-tooltip> -->
    <span>123</span>
  </template>
</el-table-column>
如下图,switch 开关切换耗时从 2.7s 左右减少到 0.5s 左右。performance 面板可以看到 patch 基本没有了,应该是模板编译时静态节点标记后,更新时就不用比对了。
基于这个思路,el-tooltip 组件会成倍的增加 patch 比对耗时,减少这个节点数量即可增强性能。
为了少些一些代码,el-tooltip 使用 disabled 属性,用于在特定场景下隐藏 tooltip,这一部分数据可以不使用 el-tooltip 节点,改动如下,使用 v-if 替换 disabled 属性功能,这样虽然会有重复代码,但可以减少节点数。
<template #default="scope">
  <!--
    <el-tooltip
      placement="top-start"
      :disabled="!(item.prop === 'column1' && scope.row[item.prop])"
    >
      <template #content>
        <span>{{ "tooltip显示" + scope.row[item.prop] }}</span>
      </template>
      <span>{{ scope.row[item.prop] }}</span>
    </el-tooltip>
  -->
  <span v-if="!(item.prop === 'column1' && scope.row[item.prop])">
    {{ scope.row[item.prop] }}
  </span>
  <el-tooltip v-else placement="top-start">
    <template #content>
      <span>{{ "tooltip显示" + scope.row[item.prop] }}</span>
    </template>
    <span>{{ scope.row[item.prop] }}</span>
  </el-tooltip>
</template>
再次测试性能,可以看到性能并没有下降多少,switch 开关切换可以做到 0.5s 左右刷新
性能数据(耗时减少80%)
table 渲染、switch 切换测试耗时如下

table 隐藏到显示 gif 图
switch 从关到开 gif 图
总结
如下图,通过 3 个小的细节改动,将 table 渲染耗时从 6.88s 减少到 1s 左右,平均减少 85% 渲染耗时,用户体验基本达到预期。完整 demo github 地址:github.com/zuoxiaobai/…[8]
在 vue3 项目中,响应式数据这块要特别注意。当遇到比较慢的场景时,建议采用如下方法进行性能优化
使用 performance 分析性能瓶颈,或者自己写一个性能耗时逻辑,这样在做性能优化时有数据参考。
针对业务代码较多场景,采用注释 + 替换成静态节点方法排查耗时较长的逻辑,针对性优化。
另外,可以使用 Vue devtools 调试工具,查看组件更新渲染耗时,排查响应式数据问题。
参考资料
[1]
https://github.com/zuoxiaobai/table-performance-demo/tree/table-base: https://github.com/zuoxiaobai/table-performance-demo/tree/table-base
[2]https://cn.vuejs.org/guide/extras/rendering-mechanism.html#compiler-informed-virtual-dom: https://cn.vuejs.org/guide/extras/rendering-mechanism.html#compiler-informed-virtual-dom
[3]https://cn.vuejs.org/guide/best-practices/performance.html#reduce-reactivity-overhead-for-large-immutable-structures: https://cn.vuejs.org/guide/best-practices/performance.html#reduce-reactivity-overhead-for-large-immutable-structures
[4]https://github.com/element-plus/element-plus/releases: https://github.com/element-plus/element-plus/releases
[5]https://github.com/zuoxiaobai/table-performance-demo/tree/2-table-use-source: https://github.com/zuoxiaobai/table-performance-demo/tree/2-table-use-source
[6]https://github.com/zuoxiaobai/table-performance-demo/tree/table-ref-shallowRef: https://github.com/zuoxiaobai/table-performance-demo/tree/table-ref-shallowRef
[7]https://github.com/zuoxiaobai/table-performance-demo/tree/getColspanRealWidth-optimize: https://github.com/zuoxiaobai/table-performance-demo/tree/getColspanRealWidth-optimize
[8]https://github.com/zuoxiaobai/table-performance-demo: https://github.com/zuoxiaobai/table-performance-demo
[9]https://mp.weixin.qq.com/s/Zj6h6szd4JTvYb5noYwxgQ#: https://mp.weixin.qq.com/s/Zj6h6szd4JTvYb5noYwxgQ#
原文链接: https://juejin.cn/post/7194516447932973112
作者:dev_zuo


 628
628


 被折叠的 条评论
为什么被折叠?
被折叠的 条评论
为什么被折叠?
 到【灌水乐园】发言


