


在前两节,讲到了两种不同方式的聚类,一种是基于距离的,一种是基于区域范围的,两种不同的聚类都是通过扩展esri/layers/GraphicsLayer方法来实现的。在本节,就详细的讲讲esri/layers/GraphicsLayer方法的扩展。
首先,在讲解扩展之前,先看看API中esri/layers/GraphicsLayer的一些参数和方法等。
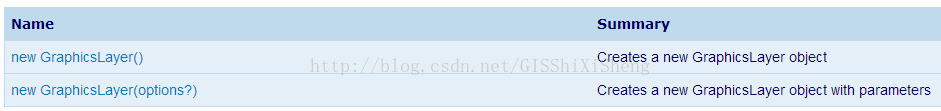
1、创建一个GraphicLayer
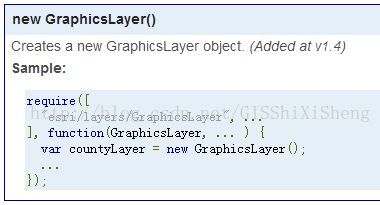
在ESRI官方的API中,创建GraphicLayer有两种方式:
例如:
或者:
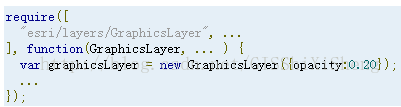
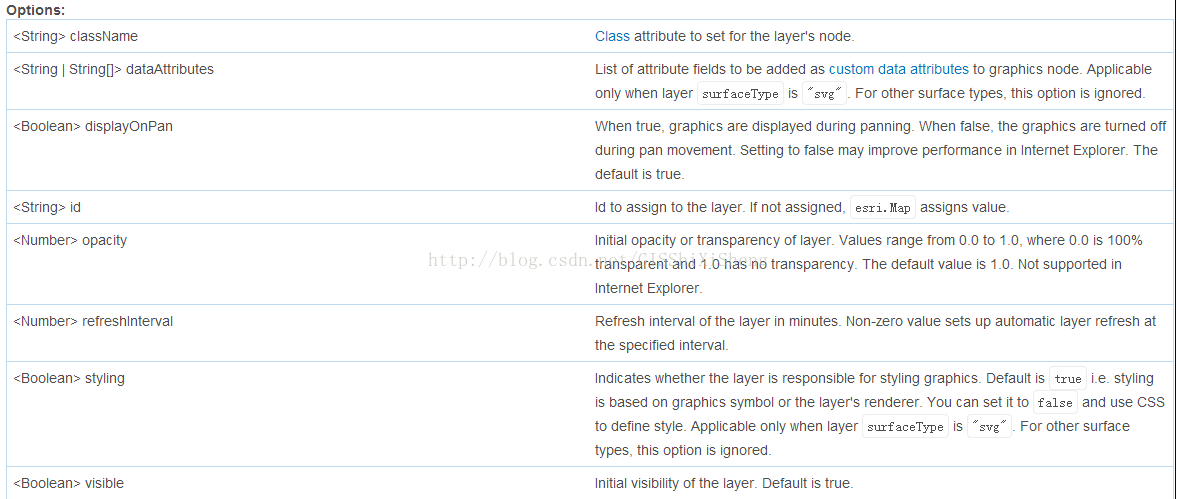
在第二种方式的options的参数包括:
2、GraphicLayer的属性
GraphicLayer的属性包括:
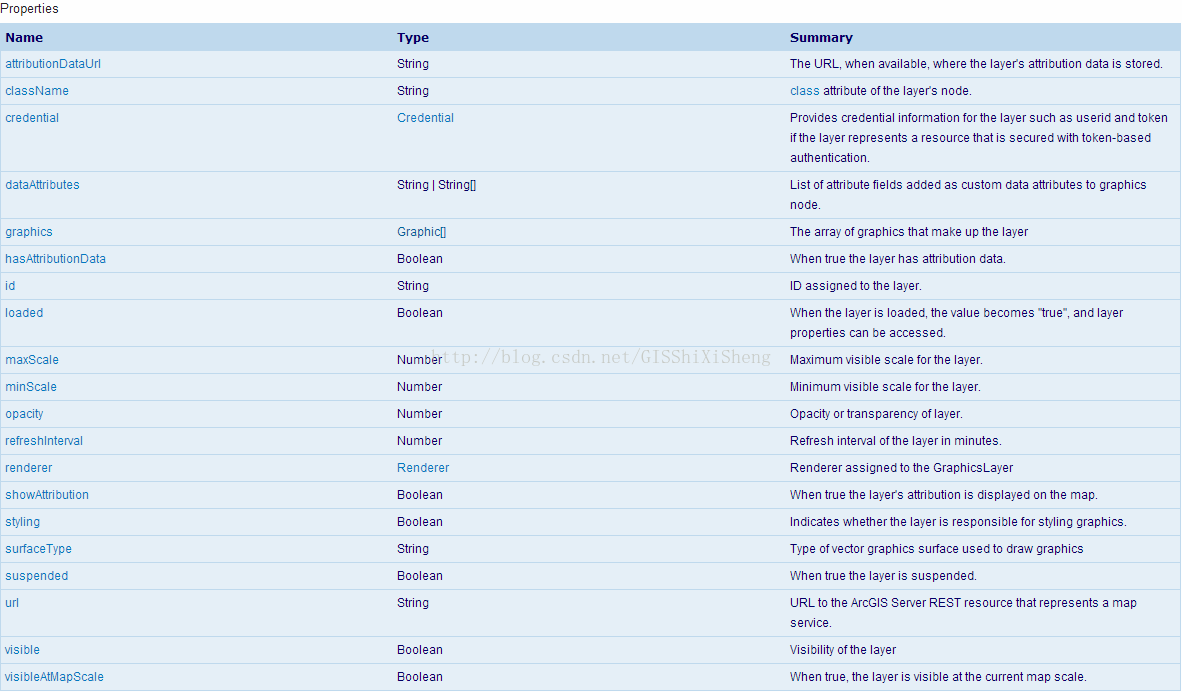
其中,有几个比较常见和重要的属性为:
a、graphics:数组,返回的参数是一个数组,为GraphicLayer中包含的Graphic对象。
b、visiable:布尔型,Graphiclayer是否可见。
c、visiableAtMapScale:布尔型,在特定比例尺下的可见性。
3、Graphiclayer的方法
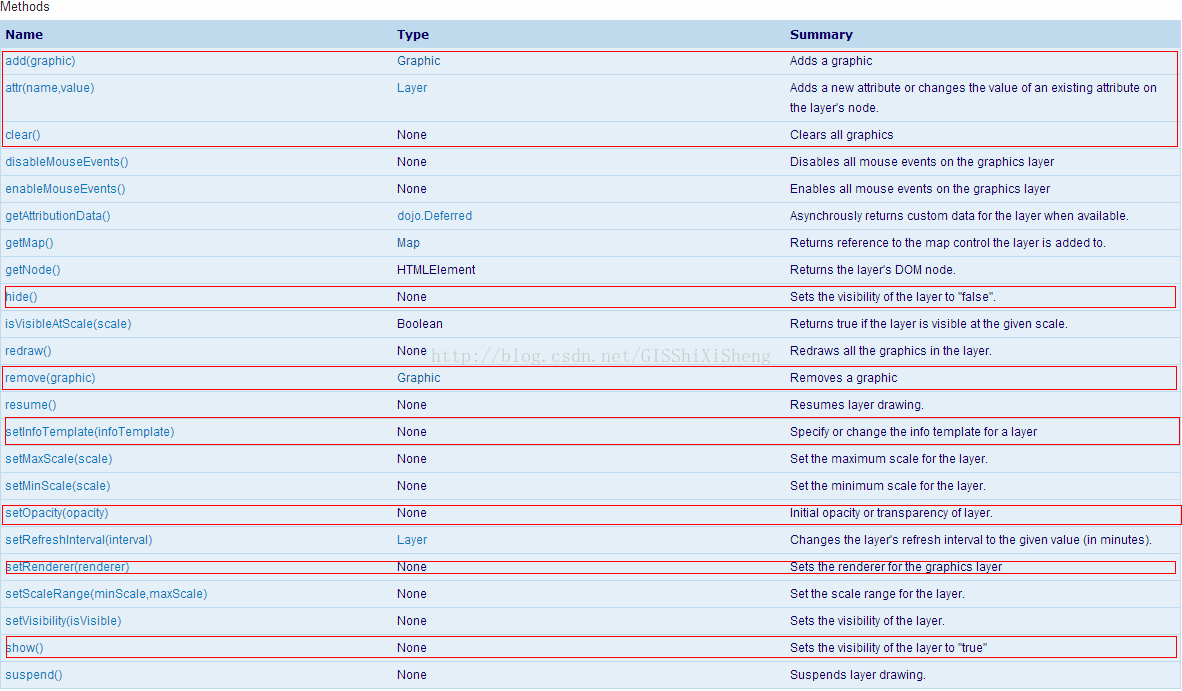
图中,红框标出的是Graphiclayer最常用的方法,详细的介绍很清楚,在此不再做赘述了。
接下来,扩展Graphiclayer。
GraphicLayer藏得很深,位于library\3.9\3.9\js\esri\layers\GraphicsLayer.js,虽然对参数变量代码做了混淆,但是有些东西还是没做变化。在做GraphicLayer扩展时,有几个是比较常用的:
a、_setMap
        // 重构esri/layers/GraphicsLayer方法
        _setMap: function(map, surface) {
            // GraphicsLayer will add its own listener here
            var div = this.inherited(arguments);
            return div;
        }
b、_unsetMap
        _unsetMap: function() {
            this.inherited(arguments);
        }
c、_draw
        _draw:function(graphic, redrawFlag, zoomFlag){
            if (!this._map) {
                return;
            }
}define([
"dojo/_base/declare",
"esri/layers/GraphicsLayer"
], function (
declare,
GraphicsLayer
) {
return declare([GraphicsLayer], {
constructor: function(options) {
//参数设置
this._id = options.id || "";
this._divId = options.chartDiv || "chart";
},
// 重构esri/layers/GraphicsLayer方法
_setMap: function(map, surface) {
// GraphicsLayer will add its own listener here
var div = this.inherited(arguments);
return div;
},
_unsetMap: function() {
this.inherited(arguments);
},
//拖拽
_onPanStartHandler: function() {
//
},
//缩放
_onZoomStartHandler:function(){
//
},
_onExtentChangeHandler: function(delta, extent, levelChange, lod) {
//
},
_draw:function(graphic){
if (!this._map) {
return;
}
//
}
});
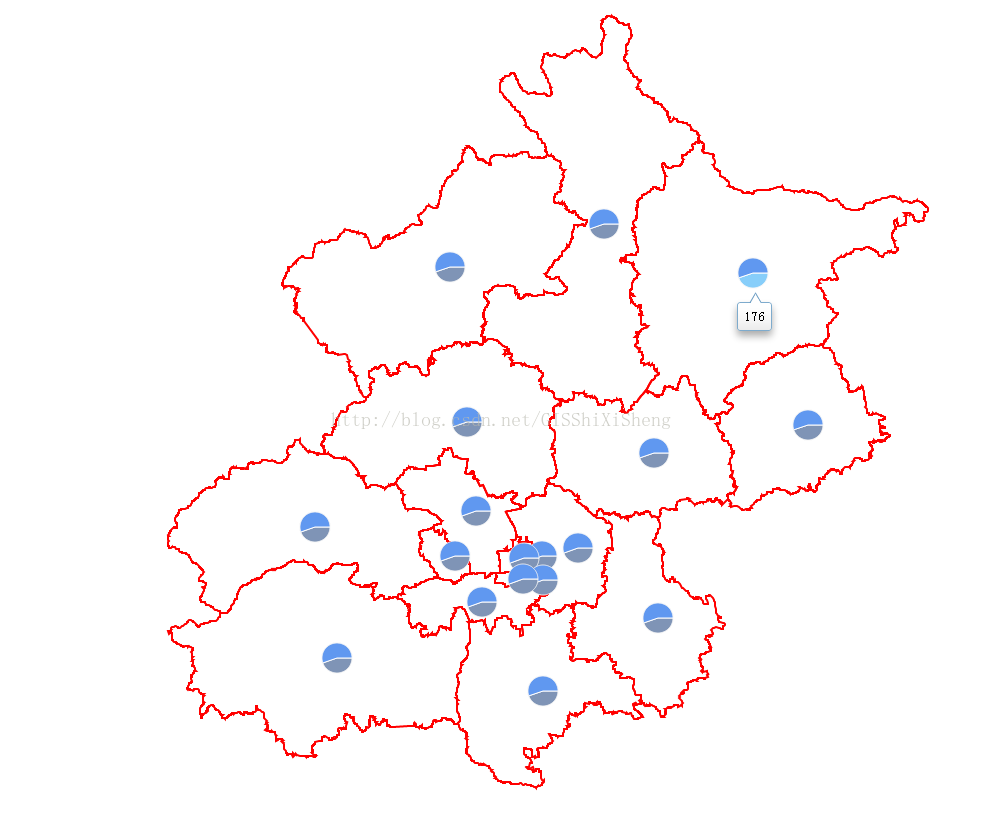
});例子:添加统计图
统计图通过dojo chart实现,代码如下:
define([
    "dojo/_base/declare",
    "esri/layers/GraphicsLayer",
    "esri/geometry/Point",
    "esri/graphic",
    "dojox/charting/Chart2D",
    "dojox/charting/themes/PlotKit/blue",
    "dojox/charting/action2d/Highlight",
    "dojox/charting/action2d/Tooltip"
], function (
    declare,
    GraphicsLayer,
    Point,
    Graphic,
    Chart2D,
    theme,
    Highlight,
    Tooltip
    ) {
    return declare([GraphicsLayer], {
        constructor: function(options) {
            this._id = options.id || "";
            this._divId = options.chartDiv || "chart";
            this._charttype = options.chartType || "Pie";
            this._chartSize = options.size || 50;
        },
        // 重构esri/layers/GraphicsLayer方法
        _setMap: function(map, surface) {
            // GraphicsLayer will add its own listener here
            var div = this.inherited(arguments);
            return div;
        },
        _unsetMap: function() {
            this.inherited(arguments);
        },
        hide: function() {
            dojo.style(dojo.byId(this._divId),{
                "display": "none"
            });
        },
        show: function() {
            dojo.style(dojo.byId(this._divId),{
                "display": ""
            });
        },
        //拖拽
        _onPanStartHandler: function() {
            this.hide();
        },
        //缩放
        _onZoomStartHandler:function(){
            this.hide();
        },
        _onExtentChangeHandler: function() {
            this._refresh(true);
        },
        _refresh: function(redraw) {
            var that=this;
            var gs = this.graphics,
                _draw = this._draw;

            for (i = 0; i < gs.length; i++) {
                _draw(gs[i], redraw);
            }
            this.show();
        },
        _draw:function(graphic, redraw){
            if (!this._map) {
                return;
            }
            if(graphic instanceof Graphic)//判断graphic是否为MapChartGraphic类型
            {
                this._drawChart(graphic,redraw);
            }
        },
        _drawChart:function(graphic,redraw){
            var showMapPt = graphic.geometry,
                attribute = graphic.attributes;
            var showPt = map.toScreen(showMapPt);
            var id=attribute.code,
                series = [attribute.male, attribute.female];
            if(redraw){
                dojo.byId(this._divId).removeChild(dojo.byId("div"+id));
            }
            if(attribute){
                var _chartDiv = dojo.doc.createElement("div");
                _chartDiv.id ="div"+id;
                dojo.style(_chartDiv, {
                    "left": (showPt.x-this._chartSize/4) + "px",
                    "top": (showPt.y-this._chartSize/2) + "px",
                    "position": "absolute",
                    "width": this._chartSize + "px",
                    "height": this._chartSize + "px"
                });
                dojo.byId(this._divId).appendChild(_chartDiv);

                var _chart = new Chart2D(_chartDiv);
                var _themes = dojox.charting.themes.PlotKit.blue;
                _themes.chart.fill = "transparent";
                _themes.chart.stroke = "transparent";
                _themes.plotarea.fill = "transparent";
                _chart.setTheme(_themes);
                switch(this._charttype){
                    case "Pie":{//饼状图
                        _chart.addPlot("default", {
                            type: this._charttype,
                            labels:false
                        });
                        break;
                    }
                    case "StackedColumns":{//柱状堆积图
                        _chart.addPlot("default", {
                            type: this._charttype,
                            labels:false,
                            markers: true,
                            gap: 2
                        });
                        break;
                    }
                    case "Lines":{//柱状堆积图
                        _chart.addPlot("default", {
                            type: this._charttype,
                            labels:false,
                            markers: true,
                            radius: 1,
                            tension:"X"
                        });
                        break;
                    }
                    default:{//柱状图
                        _chart.addPlot("default", {
                            type: this._charttype,
                            labels:false,
                            gap: 3
                        });
                        chart.addAxis("y", { vertical:true, fixLower: "major", fixUpper: "major" });
                        break;
                    }
                }
                _chart.addSeries(id, series,{stroke: {width:1}});
                //效果
                new Highlight(_chart, "default", {highlight: "lightskyblue"});
                new Tooltip(_chart, "default");
                _chart.render();
            }
        }
    });
});
实现后的效果如下:
源码下载地址:
链接:http://pan.baidu.com/s/1i3EbnF3 密码:cvbf
如有疑问,请联系:
QQ:1004740957
E-Mail:niujp08@qq.com


 8519
8519


 被折叠的 条评论
为什么被折叠?
被折叠的 条评论
为什么被折叠?
 到【灌水乐园】发言


