


写在前面的话
当当当,又要总结画图了,现在写博客都有一种美妆博主在写美妆心得的介绍。biubiu~
今天要记录的内容就是我们的python 画柱状图。
画柱状图一般我觉得就是数据可以被枚举的有限的,并且想要清晰的看出一些数据随时间的变化的趋势,或者就是不同的数据之间的对比。我觉得这个时候就可以用柱状图来表示了。
柱状图
注明一下: 这里不讲怎么安装numpy 和matplotlib 反正很简单的啦!
水平柱状图
这里我们先来介绍一下水平的柱状图。
代码如下所示:
#!/usr/bin/env python
# coding=utf-8
import matplotlib.pyplot as plt
import numpy as np
fig,ax = plt.subplots()
people = ('Tom','Dick','Harry','Slim','Jim')
y_pos = np.arange(len(people))
# range 和 arange 的作用是类似的,只不过arange 可以接受非int 类型的数据
# np.arange(len(people)) 的结果就是[0,1,2,3,4]
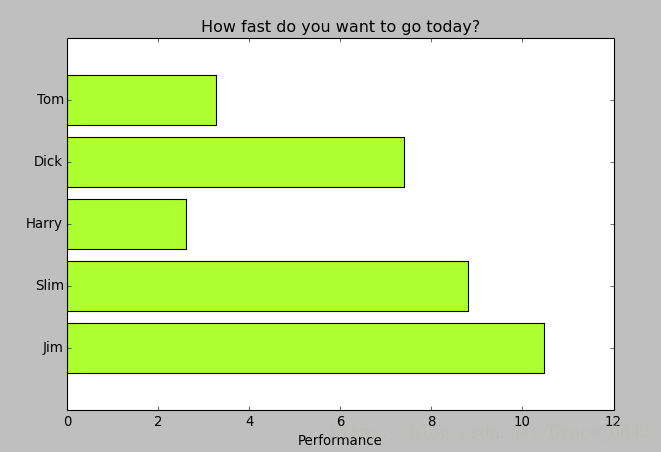
performance = 2 + 10 * np.random.rand(len(people))
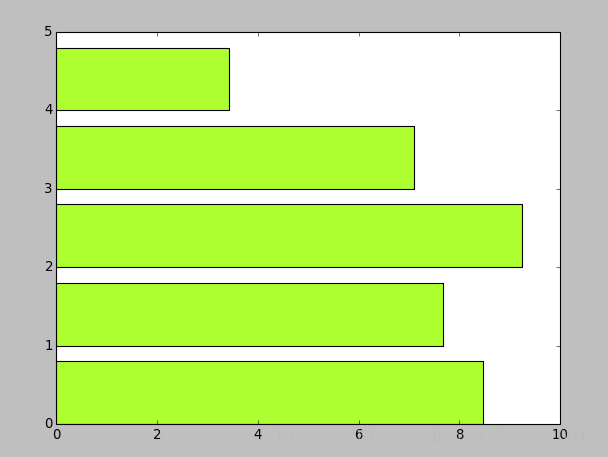
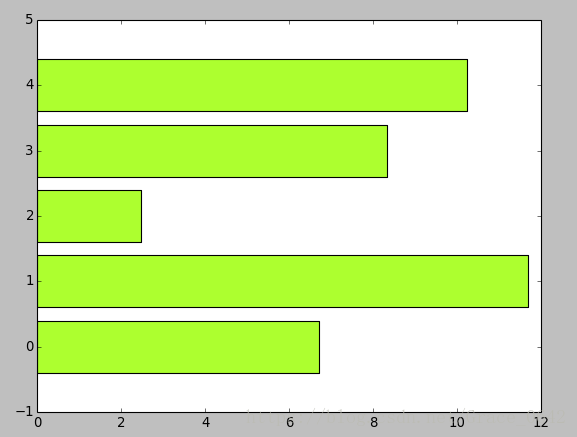
ax.barh(y_pos,performance,color='greenyellow')
plt.show()得到的图片如下所示:
现在我们来认真的分析一下代码
首先我们要画图必须要引入一些必要的库
上面的代码就是引入必要的库

之后是设定我们的条形柱状体的坐标位置
画图的语句很简单就下面这个语句所示
但是画出来的图形比较丑还比较奇怪,所以我们需要对我们的图片进行一下修容
比如说图片居中。我们在barh这个画图的函数中加下面的这个语句。 align=”center”
完整的代码如下
#!/usr/bin/env python
# coding=utf-8

import matplotlib.pyplot as plt
import numpy as np

fig,ax = plt.subplots()

people = ('Tom','Dick','Harry','Slim','Jim')

y_pos = np.arange(len(people))

# range 和 arange 的作用是类似的,只不过arange 可以接受非int 类型的数据
# np.arange(len(people)) 的结果就是[0,1,2,3,4]

performance = 2 + 10 * np.random.rand(len(people))

ax.barh(y_pos,performance,color='greenyellow',align="center")

plt.show()
看起来还是有一点丑,主要是我们的坐标轴好像没有什么意义
这个时候我们可以加下面的语句
#!/usr/bin/env python
# coding=utf-8

import matplotlib.pyplot as plt
import numpy as np

fig,ax = plt.subplots()

people = ('Tom','Dick','Harry','Slim','Jim')

y_pos = np.arange(len(people))

# range 和 arange 的作用是类似的,只不过arange 可以接受非int 类型的数据
# np.arange(len(people)) 的结果就是[0,1,2,3,4]

performance = 2 + 10 * np.random.rand(len(people))

ax.barh(y_pos,performance,color='greenyellow',align="center")

ax.set_yticks(y_pos) # 设置标度的位置

ax.set_yticklabels(people) # 设置纵坐标的每一个刻度的属性值

ax.invert_yaxis()  # 反转标度值

ax.set_xlabel('Performance') # 设置横坐标的单位

ax.set_title('How fast do you want to go today?')  # 设定图片的标题
plt.show()
设置数字
代码如下
#!/usr/bin/env python
# coding=utf-8
import matplotlib.pyplot as plt
import numpy as np
fig,ax = plt.subplots()
people = ('Tom','Dick','Harry','Slim','Jim')
y_pos = np.arange(len(people))
# range 和 arange 的作用是类似的,只不过arange 可以接受非int 类型的数据
# np.arange(len(people)) 的结果就是[0,1,2,3,4]
performance = 2 + 10 * np.random.rand(len(people))
rects = ax.barh(y_pos,performance,color='greenyellow',align="center")
ax.set_yticks(y_pos) # 设置标度的位置
ax.set_yticklabels(people) # 设置纵坐标的每一个刻度的属性值
ax.invert_yaxis() # 反转标度值
ax.set_xlabel('Performance') # 设置横坐标的单位
ax.set_title('How fast do you want to go today?') # 设定图片的标题
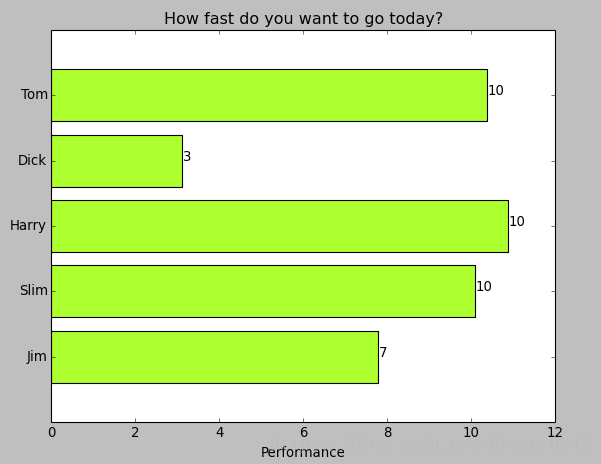
# show the number in the top of the bar
for rect,y,num in zip(rects,y_pos,performance):
x= rect.get_width()
plt.text(x+0.05,y,"%d" % int(num))
plt.show()各种精修
#!/usr/bin/env python
# coding=utf-8
import matplotlib.pyplot as plt
import numpy as np
fig,ax = plt.subplots()
people = ('Tom','Dick','Harry','Slim','Jim')
y_pos = np.arange(len(people))
# range 和 arange 的作用是类似的,只不过arange 可以接受非int 类型的数据
# np.arange(len(people)) 的结果就是[0,1,2,3,4]
performance = 2 + 10 * np.random.rand(len(people))
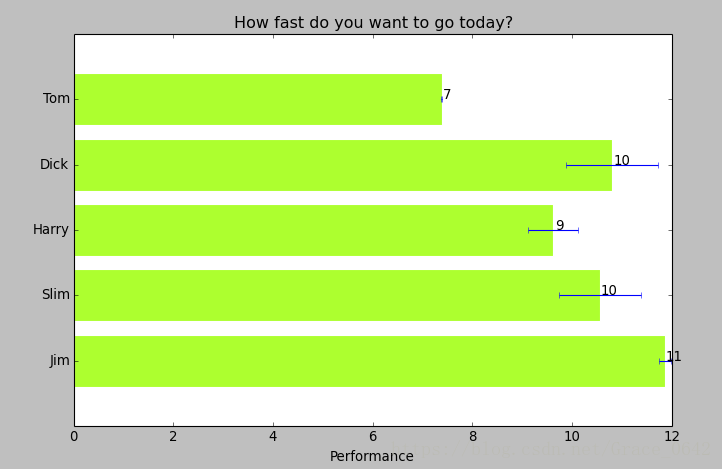
error =np.random.rand(len(people)) #W误差的范围
rects = ax.barh(y_pos,performance,color='greenyellow',align="center",edgecolor='white',xerr=error)
# edgecolor='white' 取消边缘的颜色,设置容错值 xerr=error
ax.set_yticks(y_pos) # 设置标度的位置
ax.set_yticklabels(people) # 设置纵坐标的每一个刻度的属性值
ax.invert_yaxis() # 反转标度值
ax.set_xlabel('Performance') # 设置横坐标的单位
ax.set_title('How fast do you want to go today?') # 设定图片的标题
# show the number in the top of the bar
for rect,y,num in zip(rects,y_pos,performance):
x= rect.get_width()
plt.text(x+0.05,y,"%d" % int(num))
plt.show()
写在后面的话

1


 1480
1480


 被折叠的 条评论
为什么被折叠?
被折叠的 条评论
为什么被折叠?
 到【灌水乐园】发言


