当前代码
import matplotlib.pyplot as plt
decisionNode = dict(boxstyle="sawtooth", fc="0.8")
leafNode = dict(boxstyle="round4", fc="0.8")
arrow_args = dict(arrowstyle="<-")
def plotNode(nodeTxt, centerPt, parentPt, nodeType):
createPlot.axl.annotate(nodeTxt, xy=parentPt, xycoords='axes fraction',
xytext=centerPt, textcoords='axes fraction',
va='center', ha='center', bbox=nodeType,
arrowprops=arrow_args)
def createPlot():
fig = plt.figure(1, facecolor='white')
fig.clf()
createPlot.axl = plt.subplot(111, frameon=False)
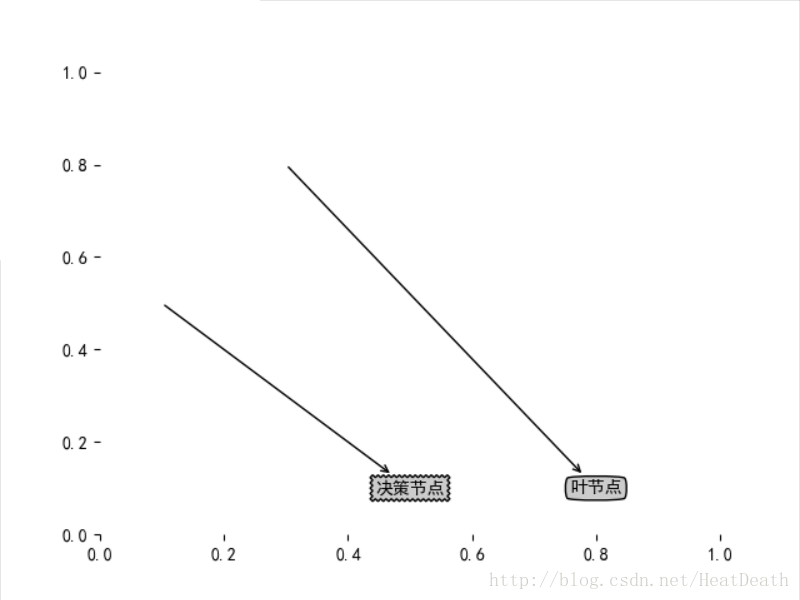
plotNode(U'决策节点', (0.5, 0.1), (0.1, 0.5), decisionNode)
plotNode(U'叶节点', (0.8, 0.1), (0.3, 0.8), leafNode)
plt.show()
createPlot()
生成图片

改进方法
import matplotlib.pyplot as plt
from pylab import *
mpl.rcParams['font.sans-serif'] = ['SimHei']
decisionNode = dict(boxstyle="sawtooth", fc="0.8")
leafNode = dict(boxstyle="round4", fc="0.8")
arrow_args = dict(arrowstyle="<-")
def plotNode(nodeTxt, centerPt, parentPt, nodeType):
createPlot.axl.annotate(nodeTxt, xy=parentPt, xycoords='axes fraction',
xytext=centerPt, textcoords='axes fraction',
va='center', ha='center', bbox=nodeType,
arrowprops=arrow_args)
def createPlot():
fig = plt.figure(1, facecolor='white')
fig.clf()
createPlot.axl = plt.subplot(111, frameon=False)
plotNode(U'决策节点', (0.5, 0.1), (0.1, 0.5), decisionNode)
plotNode(U'叶节点', (0.8, 0.1), (0.3, 0.8), leafNode)
plt.show()
createPlot()
生成图片


 3208
3208

 被折叠的 条评论
为什么被折叠?
被折叠的 条评论
为什么被折叠?
 到【灌水乐园】发言


