


BlockCanary源码解析
在讲解BlockCanary源码之前,我们还是需要将一些前置的知识点。本文不讲Handler的原理了,不太懂的同学自己去百度看一下吧。
什么是卡顿
在讲解卡顿问题之前,我们需要讲一下帧率这个概念。帧率是以帧称为单位的位图图像连续出现在显示器上的频率。我将一个例子,电影播放。电影其实就是很多张照片(帧)的一个集合,那为什么看起来是一个连续的过程呢?因为电影每一秒出现过的图片不止一张。实际上电影一般一秒出现的图片张数会在20-30张。假设电影一秒出现了24张图片,那么这个电影的帧率就是24。帧率就是一秒中,出现了多少帧。
知道了什么是帧率,那么问题来了,为什么会出现卡顿呢?卡顿在我们的视觉上面的表现就是原本是流畅的动画画面,现在变的不流畅了。我们上面讲过,动画其实是由很多图片构成。如果在一个24帧的电影中,突然有一秒钟,在这一秒钟出现了掉帧。也就是原本0...23的图片变成了 0...10...12...23.中间的某一帧没有渲染出来,那么这个在我们视觉上就会出现不流畅的现象。也就是卡顿的现象。上面就是电影上出现卡顿的现象。那么在我们android系统上呢?
Android渲染机制
在高刷手机没有出现之前,我们手机屏幕的帧率是60。就是意味着1秒钟会有60个画面出现。那么也就是16ms就要有一个画面渲染。Android系统每隔16ms发出VSYNC信号,触发对UI进行渲染, 如果每次渲染都成功,这样就能够达到流畅的画面所需要的60帧,为了能够实现60fps,这意味着程序的大多数操作都必须在16ms内完成。如果超过了16ms那么可能就出现丢帧的情况。如果掉帧的频率很高,也就是导致卡顿的情况。
BlockCanary源码解析
那么在android中,BlockCanary是怎么帮助我们去做卡顿检测的呢。今天我们就来讲解一下BlockCanary检测卡顿的原理。
一般我们都通过以下的代码方式去开启我们的卡顿检测。
public class DemoApplication extends Application {
    @Override
    public void onCreate() {
        // ...
        // Do it on main process
        BlockCanary.install(this, new AppBlockCanaryContext()).start();
    }
}
这段代码主要有两部分,一部分是install,一部分是start。我们先看install部分
install阶段
BlockCanary#install()
public static BlockCanary install(Context context, BlockCanaryContext blockCanaryContext) {
    //BlockCanaryContext.init会将保存应用的applicationContext和用户设置的配置参数
        BlockCanaryContext.init(context, blockCanaryContext);
    //etEnabled将根据用户的通知栏消息配置开启
        setEnabled(context, DisplayActivity.class, BlockCanaryContext.get().displayNotification());
        return get();
    }
BlockCanary#get()
//使用单例创建了一个BlockCanary对象
public static BlockCanary get() {
    if (sInstance == null) {
        synchronized (BlockCanary.class) {
            if (sInstance == null) {
                sInstance = new BlockCanary();
            }
        }
    }
    return sInstance;
}
BlockCanary()
private BlockCanary() {
      //初始化blockCanaryInternals调度类
      BlockCanaryInternals.setContext(BlockCanaryContext.get());
      mBlockCanaryCore = BlockCanaryInternals.getInstance();
      //为BlockCanaryInternals添加拦截器(责任链)BlockCanaryContext对BlockInterceptor是空实现
      mBlockCanaryCore.addBlockInterceptor(BlockCanaryContext.get());
      if (!BlockCanaryContext.get().displayNotification()) {
          return;
      }
      //DisplayService只在开启通知栏消息的时候添加,当卡顿发生时将通过DisplayService发起通知栏消息
      mBlockCanaryCore.addBlockInterceptor(new DisplayService());

  }
BlockCanaryInternals.getInstance()
static BlockCanaryInternals getInstance() {
    if (sInstance == null) {
        synchronized (BlockCanaryInternals.class) {
            if (sInstance == null) {
                sInstance = new BlockCanaryInternals();
            }
        }
    }
    return sInstance;
}
BlockCanaryInternals
public BlockCanaryInternals() {
        //初始化栈采集器
        stackSampler = new StackSampler(
                Looper.getMainLooper().getThread(),
                sContext.provideDumpInterval());
        //初始化cpu采集器
        cpuSampler = new CpuSampler(sContext.provideDumpInterval());

        //初始化LooperMonitor,并实现了onBlockEvent的回调,该回调会在触发阈值后被调用,这里面比较重要
        setMonitor(new LooperMonitor(new LooperMonitor.BlockListener() {

            @Override
            public void onBlockEvent(long realTimeStart, long realTimeEnd,
                                     long threadTimeStart, long threadTimeEnd) {
                ArrayList<String> threadStackEntries = stackSampler
                        .getThreadStackEntries(realTimeStart, realTimeEnd);
                if (!threadStackEntries.isEmpty()) {
                    BlockInfo blockInfo = BlockInfo.newInstance()
                            .setMainThreadTimeCost(realTimeStart, realTimeEnd, threadTimeStart, threadTimeEnd)
                            .setCpuBusyFlag(cpuSampler.isCpuBusy(realTimeStart, realTimeEnd))
                            .setRecentCpuRate(cpuSampler.getCpuRateInfo())
                            .setThreadStackEntries(threadStackEntries)
                            .flushString();
                    LogWriter.save(blockInfo.toString());

                    if (mInterceptorChain.size() != 0) {
                        for (BlockInterceptor interceptor : mInterceptorChain) {
                            interceptor.onBlock(getContext().provideContext(), blockInfo);
                        }
                    }
                }
            }
        }, getContext().provideBlockThreshold(), getContext().stopWhenDebugging()));

        LogWriter.cleanObsolete();
    }
当install进行初始化完成后,接着会调用start()方法,实现如下:
start阶段
BlockCanary#start()
//BlockCanary#start()
public void start() {
    if (!mMonitorStarted) {
        mMonitorStarted = true;
        //把mBlockCanaryCore中的monitor设置MainLooper中进行监听
        Looper.getMainLooper().setMessageLogging(mBlockCanaryCore.monitor);
    }
}
这里面的实现也比较简单,就是获取到主线程Looper然后将上一步创建的LooperMonitor设置到主线程Looper里面的MessageLogging。
到这里然后呢?卧槽,没了一开始看这里的源码的时候我也是很懵逼的。然后我就去github上看了,然后呢,我看到了这么一张图。
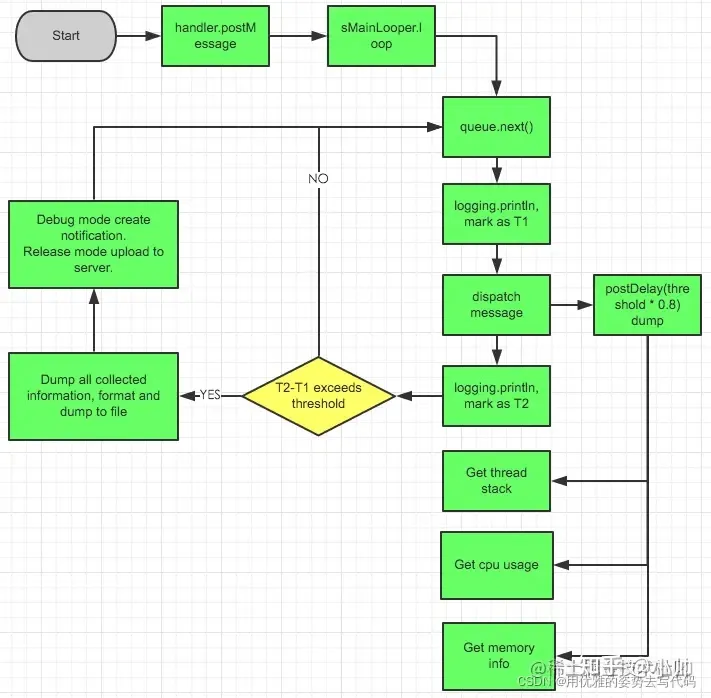
通过这张图,我可以知道,真正开始检测的不是start(),而是Looper里面loop()函数
Looper#loop
public static void loop() {
    final Looper me = myLooper();
    if (me == null) {
        throw new RuntimeException("No Looper; Looper.prepare() wasn't called on this thread.");
    }
    if (me.mInLoop) {
        Slog.w(TAG, "Loop again would have the queued messages be executed"
               + " before this one completed.");
    }

    me.mInLoop = true;
    final MessageQueue queue = me.mQueue;

    // Make sure the identity of this thread is that of the local process,
    // and keep track of what that identity token actually is.
    Binder.clearCallingIdentity();
    final long ident = Binder.clearCallingIdentity();

    // Allow overriding a threshold with a system prop. e.g.
    // adb shell 'setprop log.looper.1000.main.slow 1 && stop && start'
    final int thresholdOverride =
        SystemProperties.getInt("log.looper."
                                + Process.myUid() + "."
                                + Thread.currentThread().getName()
                                + ".slow", 0);

    boolean slowDeliveryDetected = false;

    for (;;) {
        Message msg = queue.next(); // might block
        if (msg == null) {
            // No message indicates that the message queue is quitting.
            return;
        }

        // This must be in a local variable, in case a UI event sets the logger
        final Printer logging = me.mLogging;
        if (logging != null) {
            logging.println(">>>>> Dispatching to " + msg.target + " " +
                            msg.callback + ": " + msg.what);
        }
        // Make sure the observer won't change while processing a transaction.
        final Observer observer = sObserver;

        final long traceTag = me.mTraceTag;
        long slowDispatchThresholdMs = me.mSlowDispatchThresholdMs;
        long slowDeliveryThresholdMs = me.mSlowDeliveryThresholdMs;
        if (thresholdOverride > 0) {
            slowDispatchThresholdMs = thresholdOverride;
            slowDeliveryThresholdMs = thresholdOverride;
        }
        final boolean logSlowDelivery = (slowDeliveryThresholdMs > 0) && (msg.when > 0);
        final boolean logSlowDispatch = (slowDispatchThresholdMs > 0);

        final boolean needStartTime = logSlowDelivery || logSlowDispatch;
        final boolean needEndTime = logSlowDispatch;

        if (traceTag != 0 && Trace.isTagEnabled(traceTag)) {
            Trace.traceBegin(traceTag, msg.target.getTraceName(msg));
        }

        final long dispatchStart = needStartTime ? SystemClock.uptimeMillis() : 0;
        final long dispatchEnd;
        Object token = null;
        if (observer != null) {
            token = observer.messageDispatchStarting();
        }
        long origWorkSource = ThreadLocalWorkSource.setUid(msg.workSourceUid);
        try {
            msg.target.dispatchMessage(msg);
            if (observer != null) {
                observer.messageDispatched(token, msg);
            }
            dispatchEnd = needEndTime ? SystemClock.uptimeMillis() : 0;
        } catch (Exception exception) {
            if (observer != null) {
                observer.dispatchingThrewException(token, msg, exception);
            }
            throw exception;
        } finally {
            ThreadLocalWorkSource.restore(origWorkSource);
            if (traceTag != 0) {
                Trace.traceEnd(traceTag);
            }
        }
        if (logSlowDelivery) {
            if (slowDeliveryDetected) {
                if ((dispatchStart - msg.when) <= 10) {
                    Slog.w(TAG, "Drained");
                    slowDeliveryDetected = false;
                }
            } else {
                if (showSlowLog(slowDeliveryThresholdMs, msg.when, dispatchStart, "delivery",
                                msg)) {
                    // Once we write a slow delivery log, suppress until the queue drains.
                    slowDeliveryDetected = true;
                }
            }
        }
        if (logSlowDispatch) {
            showSlowLog(slowDispatchThresholdMs, dispatchStart, dispatchEnd, "dispatch", msg);
        }

        if (logging != null) {
            logging.println("<<<<< Finished to " + msg.target + " " + msg.callback);
        }

        // Make sure that during the course of dispatching the
        // identity of the thread wasn't corrupted.
        final long newIdent = Binder.clearCallingIdentity();
        if (ident != newIdent) {
            Log.wtf(TAG, "Thread identity changed from 0x"
                    + Long.toHexString(ident) + " to 0x"
                    + Long.toHexString(newIdent) + " while dispatching to "
                    + msg.target.getClass().getName() + " "
                    + msg.callback + " what=" + msg.what);
        }

        msg.recycleUnchecked();
    }
}loop()里面的代码很长,我们讲解blockCanary的时候不需要过分关注其他部分,还记得我们start做的事情吗,我们去设置了setMessageLogging。所以先看看setMessageLogging方法
Looper#setMessageLogging
public void setMessageLogging(@Nullable Printer printer) {
    mLogging = printer;
}其实就是将创建的LooperMonitor赋值给mLogging,那么我们只需要关注mLogging在loop()中的代码就好了。我们发现就是调用了两次println。一个是在msg.target.dispatchMessage(msg)之前,一个是在msg.target.dispatchMessage(msg)之后。也就是说这两次调用,一次是处理信号之前,一个是处理信号之后。那么通过实现LooperMonitor里面的println方法,我们就可以得出一些时间差。所以,接下来我们要看的是LooperMonitor里面的println方法
MainLooper#println()
//MainLooper#println()
@Override
public void println(String x) {
    //如果再debug模式,不执行监听
    if (mStopWhenDebugging && Debug.isDebuggerConnected()) {
        return;
    }
    if (!mPrintingStarted) {  //dispatchMesage前执行的println
        //记录开始时间
        mStartTimestamp = System.currentTimeMillis();
        mStartThreadTimestamp = SystemClock.currentThreadTimeMillis();
        mPrintingStarted = true;
        //开始采集栈及cpu信息
        startDump();
    } else {  //dispatchMesage后执行的println
        //获取结束时间
        final long endTime = System.currentTimeMillis();
        mPrintingStarted = false;
        //判断耗时是否超过阈值
        if (isBlock(endTime)) {
            notifyBlockEvent(endTime);
        }
        stopDump();
    }
}

//判断是否超过阈值
 private boolean isBlock(long endTime) {
     return endTime - mStartTimestamp > mBlockThresholdMillis;//这个阈值是我们自己设置的
 }

//如果超过阈值,回调卡顿的监听,说明卡顿了
private void notifyBlockEvent(final long endTime) {
    final long startTime = mStartTimestamp;
    final long startThreadTime = mStartThreadTimestamp;
    final long endThreadTime = SystemClock.currentThreadTimeMillis();
    HandlerThreadFactory.getWriteLogThreadHandler().post(new Runnable() {
        @Override
        public void run() {
            mBlockListener.onBlockEvent(startTime, endTime, startThreadTime, endThreadTime);
        }
    });
}
其实这里卡顿检测的源码也还是比较简单的,它的原理就是通过重新实现looper里面的logging,然后通过println函数去判断有没有出现卡顿。BlockCanary的流程图在上面也出现了。所以这篇博客也就写道这里吧。希望对大家,对于卡顿的理解有一定的帮助。


 1324
1324


 被折叠的 条评论
为什么被折叠?
被折叠的 条评论
为什么被折叠?
 到【灌水乐园】发言


