


点击上方 前端Q,关注公众号
回复加群,加入前端Q技术交流群
写在前面
众所周知啊骑行🚲是一项非常健康、锻炼身体素质、拓宽视野的一项运动,在如今的2024年啊,越来越多的小孩年轻人等等各类人群都加入了骑行这项运,动哈哈本人也不例外😲,像今年的在中国举办的环广西更是加深了国内的骑行氛围,那导播的运de镜水平相比去年越来越有观赏性。

在骑行过程中,其中一些想记录自己骑行数据的骑友会选择一些子骑行软件啊,比如像行者、Strva、捷安特骑行等等这些子,功能都非常丰富,他们都会有_路线规划_这个功能,大部分规划的方案我知道的大概分为 起始点规划、起始+途径点规划、GPX文件导入这三个主要功能前二者都是靠输入明确地点来确定路线,对于没有明确骑行目的地、选择困难症的一些朋友想必是一大考验,于是我就在想可不可以在地图上画一个大概的线路来生成地图?答案是可以的!
技术分析
灵感来自高德app中运动的大栏中有一个跑步线路规划这一功能,其中的绘制路线就是我们想要的功能,非常方便在地图上画一个大概的线路,然后自动帮你匹配道路上,但是高德似乎没有道路匹配得API?
但是!他有线路纠偏这个功能,这个API大概的功能就是把你历史行进过的线路纠偏到线路上,我们可以将画好的线路模拟出一段行驶轨迹,模拟好方向角、时间和速度,就可以了,这就是我们下面要做得手绘线路这个功能,规划线路那肯定不能只有这一种这么单一啦,再加上一个支持添加途径点得线路规划功能岂不美哉?
效果截图和源码地址
UI截图
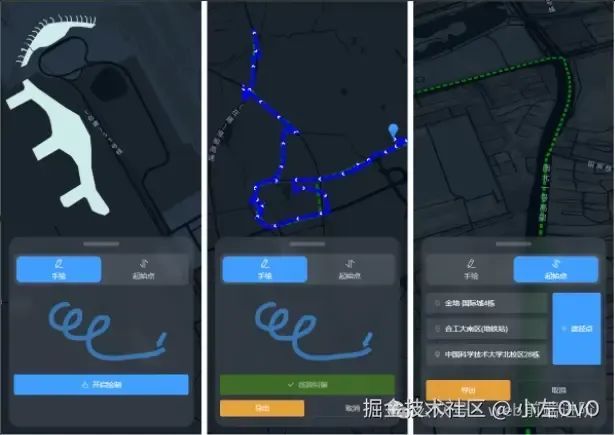
导出效果截图

仓库地址 :github.com/zuowenwu/Li…[1]
手绘线路+线路纠偏 代码实现
首先是要明确画线的操作,分三步:按下、画线和抬起的操作:
this.map.on("touchstart", (e) => {});// 准备画线
  this.map.on("touchend", (e) => {});// 结束画线
  this.map.on("touchmove");// 画线中
最重要的代码是画线的操作,此时我们设置为地图不可拖动,然后记录手指在地图上的位置即可:
//路径
this.path = []
// 监听滑动配合节流(这里节流是为了减少采样过快避免造成不必要的开销)
this.map.on("touchmove",_.throttle((e) => {
    // 点
    const position = [e.lnglat.lng, e.lnglat.lat];

    // 数组长度为0则第一个点为起点marker
    if (!this.path.length) {
        this.path.push(position);
        new this.AMap.Marker({ map: this.map, position: position });
        return;
    }
    //满足两点创建线
    if (this.path.length == 1) {
  this.path.push(position);
  this.line = new this.AMap.Polyline({
   map: this.map,
   path: this.path,
   strokeColor: "#FF33FF",
   strokeWeight: 6,
   strokeOpacity: 0.5,
  });
  return;
     }
       //添加path
      if (this.path.length > 1) {
  this.path.push(position);
  this.line.setPath(this.path);
        }
    }, 30)
);
线连接好了,可以导出了!。。吗?那肯定不是,手指在屏幕上画线肯定会和道路有很大的偏差的,我们可以使用高德的线路纠偏功能,因为该功能需要方向角、速度和时间,我们可以把刚刚模拟的线路path设置一下:
let arr = this.path.map((item, index) => {
// 默认角度
let angle = 0;
// 初始时间戳
let tm = 1478031031;
// 和下一个点的角度
if (this.path[index + 1]) {
// 计算与正北方向的夹角
const north = turf.bearing(turf.point([item[0], item[1]]), turf.point([item[0], item[1] + 1]));
// 使用正北方向的点
angle = north < 0 ? (360 + north) : north;
}
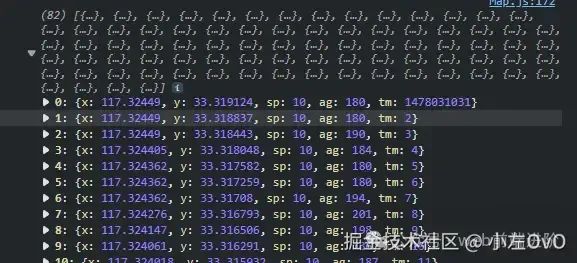
return {
x: item[0], //经度
y: item[1],//维度
sp: 10,//速度
ag: Number(angle).toFixed(0),//与正北的角度
tm: !index ? tm : 1 + index,//时间
};
});这里的数据格式就是这样的:要注意一下,第一个tm是初始的时间戳,后面都是在[index-1]+距离上次的时间,角度则是与正北方向的夹角而不是和上一个点的夹角,这里我差点弄混淆了
然后使用线路纠偏:
graspRoad.driving(arr, (error, result) => {
if (!error) {
var path2 = [];
var newPath = result.data.points;
for (var i = 0; i < newPath.length; i += 1) {
path2.push([newPath[i].x, newPath[i].y]);
}
var newLine = new this.AMap.Polyline({
path: path2,
strokeWeight: 8,
strokeOpacity: 0.8,
strokeColor: "#00f",
showDir: true,
});
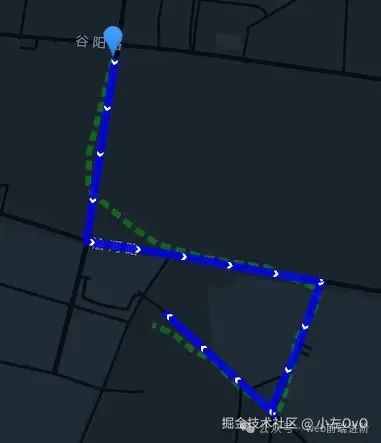
this.map.add(newLine);
}
});绿色是手动画的线,蓝色是纠偏到道路上的线,可以看的出来效果还是很不错的
OK!接下来是导出手机或者码表使用的GPX格式文件的代码,这里使用插件geojson-to-gpx,直接npm i geojson-to-gpx即可,然后导入使用,代码如下:
import GeoJsonToGpx from "@dwayneparton/geojson-to-gpx";

// 转为GeoJSON
const geoJSON = turf.lineString(this.path);
const options = {
 metadata: {
  name: "导出为GPX",
  author: {
   name: "XiaoZuoOvO",
  },
 },
};
//转为geoJSON
const gpxLine = GeoJsonToGpx(geoJSON, options);
const gpxString = new XMLSerializer().serializeToString(gpxLine);

const link = document.createElement("a");
link.download = "高德地图路线绘制.gpx";
const blob = new Blob([gpxString], { type: "text/xml" });
link.href = window.URL.createObjectURL(blob);
link.click();
ElMessage.success("导出PGX成功");
好的,以上就是手绘线路的大概功能!接下来是我们的线路规划功能。
起终点和定义途径点的线路规划 代码实现
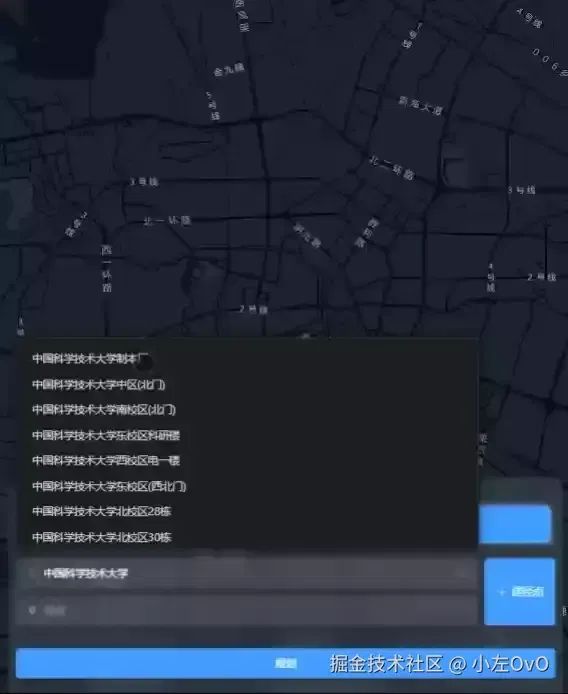
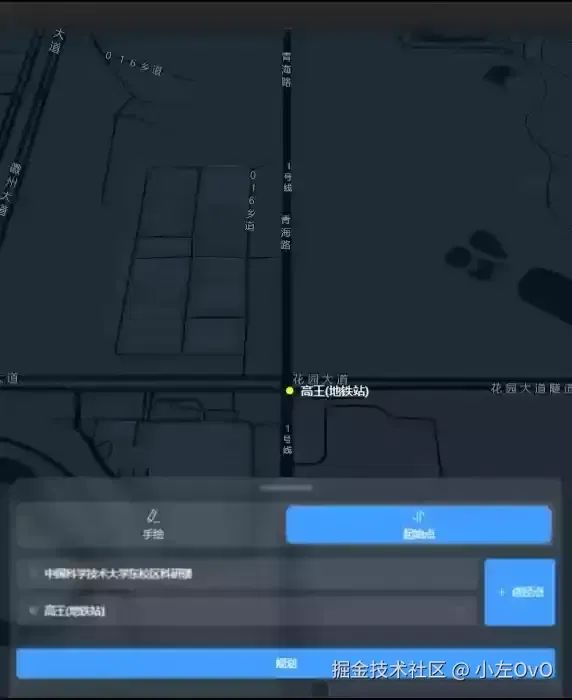
虽然说这个功能大多骑行软件都有,但是我们要做就做好用的,支持添加途径点,我们这里使用高德的线路规划2.0,这个API支持添加途径点,再配合上elementplus的el-autocomplete配合搜索,搜索地点使用搜索POI2.0来搜索地点,以下是代码实现,完整代码在github
//html
<el-autocomplete
:prefix-icon="Location"
v-model.trim="start"
:trigger-on-focus="false"
clearable
size="large"
placement="top-start"
:fetch-suggestions="querySearch"
@select="handleSelectStart"
placeholder="起点" />
//js
//搜索地点函数
const querySearch = async (queryString, cb) => {
if (!queryString) return;
const res = await inputtips(queryString);//inputtips是封装好的
if (res.status == "1") {
const arr = res.tips.map((item) => {
return {
value: item.name,
name: item.name,
district: item.district,
address: item.address,
location: item.location,
};
});
cb(arr);
return;
}
};
//自行车路径规划函数
const plan = async () => {
path = [];
const res = await driving({
origin: startPositoin.value,//起点
destination: endPosition.value,//终点
cartype: 1, //电动车/自行车
waypoints: means.value.map((item) => item.location).join(";"),//途径点
});
if (res.status == "1") {
res.route.paths[0].steps.map((item) => {
const linestring = item.polyline;
path = path.concat(
linestring.split(";").map((item) => {
const arr = item.split(",");
return [Number(arr[0]), Number(arr[1])];
})
);
});
}
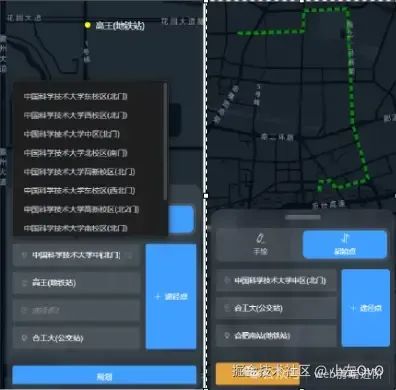
};
//......................完整代码见github..............................搜索和规划效果截图:
以上就是手绘线路和途径点起点终点两个功能,接下来我们干个题外事,我们优化一下高德的 setCenter 和 setFitView,高德的动画太过于线性,我们这里模仿一下cesium和mapbox的效果,使用丝滑贝塞尔曲线来插值过度,配合高德Loca镜头动画
动画效果优化
首先是写一个setCenter,使用的时候传入即可,效果图和代码:
export function panTo(center, map, loca) {
 const curZoom = map.getZoom();
 const curPitch = map.getPitch();
 const curRotation = map.getRotation();
 const curCenter = [map.getCenter().lng, map.getCenter().lat];

 const targZoom = 17;
 const targPitch = 45;
 const targRotation = 0;
 const targCenter = center;

 const route = [
  {
   pitch: {
    value: targPitch,
    duration: 2000,
    control: [
     [0, curPitch],
     [1, targPitch],
    ],
    timing: [0.420, 0.145, 0.000, 1],
   },
   zoom: {
    value: targZoom,
    duration: 2500,
    control: [
     [0, curZoom],
     [1, targZoom],
    ],
    timing: [0.315, 0.245, 0.405, 1.000],
   },
   rotation: {
    value: targRotation,
    duration: 2000,
    control: [
     [0, curRotation],
     [1, targRotation],
    ],
    timing: [1.000, 0.085, 0.460, 1],
   },
   center: {
    value: targCenter,
    duration: 1500,
    control: [curCenter, targCenter],
    timing: [0.0, 0.52, 0.315, 1.0],
   },
  },
 ];

 // 如果用户有操作则停止动画
 map.on("mousewheel", () => {
  loca.animate.stop();
 });
 loca.viewControl.addAnimates(route, () => {});
 loca.animate.start();
}
接下来是setFitView:
export function setFitView(center, zoom, map, loca) {
 const curZoom = map.getZoom();
 const curPitch = map.getPitch();
 const curRotation = map.getRotation();
 const curCenter = [map.getCenter().lng, map.getCenter().lat];

 const targZoom = zoom;
 const targPitch = 0;
 const targRotation = 0;
 const targCenter = center;

 const route = [
  {
   pitch: {
    value: targPitch,
    duration: 1000,
    control: [
     [0, curPitch],
     [1, targPitch],
    ],
    timing: [0.23, 1.0, 0.32, 1.0],
   },
   zoom: {
    value: targZoom,
    duration: 2500,
    control: [
     [0, curZoom],
     [1, targZoom],
    ],
    timing: [0.13, 0.31, 0.105, 1],
   },
   rotation: {
    value: targRotation,
    duration: 1000,
    control: [
     [0, curRotation],
     [1, targRotation],
    ],
    timing: [0.13, 0.31, 0.105, 1],
   },
   center: {
    value: targCenter,
    duration: 1000,
    control: [curCenter, targCenter],
    timing: [0.13, 0.31, 0.105, 1],
   },
  },
 ];

 // 如果用户有操作则停止动画
 map.on("mousewheel", () => {
  loca.animate.stop();
 });

 loca.viewControl.addAnimates(route, () => {});

 loca.animate.start();
}

export function getFitCenter(points) {
 let features = turf.featureCollection(points.map((point) => turf.point(point)));
 let center = turf.center(features);
 return [center.geometry.coordinates[0], center.geometry.coordinates[1]];
}

export function setFitCenter(points, map) {
 const center = getFitCenter(points);
}


//使用
setFitView(getFitCenter(path), getFitZoom(map, path), map, loca);
结束
先贴上仓库地址:github.com/zuowenwu/Li…[2]
最后送几张自己拍的照片吧哈哈哈


原文地址:https://juejin.cn/post/7430616540804153394
参考资料
[1]
https://github.com/zuowenwu/LineDrawPlanning.git
[2]https://github.com/zuowenwu/LineDrawPlanning.git

往期推荐

IntersectionObserver + scrollIntoView 实现电梯导航


最后
欢迎加我微信,拉你进技术群,长期交流学习...
欢迎关注「前端Q」,认真学前端,做个专业的技术人...

点个在看支持我吧


 被折叠的 条评论
为什么被折叠?
被折叠的 条评论
为什么被折叠?
 到【灌水乐园】发言


