


t-SNE可视化图像特征
t-SNE(t-Distributed Stochastic Neighbor Embedding)是一种非线性降维技术,主要用途为对高维数据进行可视化。
easy sample(使用sklearn包):
from matplotlib.offsetbox import OffsetImage, AnnotationBbox
from sklearn.manifold import TSNE
import cv2
import numpy as np
import matplotlib.pyplot as plt


# 传入图像的embedding特征和对应的图像路径
def draw_tsne(features, imgs):
    """
    Args:
        feature: [n_samples  embed_dim], full data embedding of test samples.
        imgs:        list [n_samples], list of datapaths corresponding to <feature>
    """
    #print(imgs)
    # 初始化一个TSNE模型,这里的参数设置可以查看SKlearn的官网
    tsne = TSNE(n_components=2, init='pca', perplexity=30)
    # Y是降成两维后的数据
    Y = tsne.fit_transform(features)
    fig, ax = plt.subplots()
    # 设置图像大小
    # fig.set_size_inches(21.6, 14.4)
    plt.axis('off')
    imscatter(Y[:, 0], Y[:, 1], imgs, zoom=0.1, ax=ax)
    plt.savefig(fname='figure.jpg', format='jpg')
    plt.show()


def imscatter(x, y, images, zoom, ax=None):
    artists = []
    for x0, y0, image in zip(x, y, images):
        print(image)
        im = cv2.imread(image)
        im = cv2.resize(im, (224, 224))
        im = cv2.cvtColor(im, cv2.COLOR_BGR2RGB)
        im_f = OffsetImage(im, zoom=zoom)
        ab = AnnotationBbox(im_f, (x0, y0), xycoords='data', frameon=False)
        artists.append(ax.add_artist(ab))
    ax.update_datalim(np.column_stack([x, y]))
    ax.autoscale()
    return artists


x = np.array([[0, 0, 0], [0, 1, 1], [1, 0, 1], [1, 1, 1]])
y = ['D:/000001.jpg',
     'D:/000002.jpg',
     'D:/000003.jpg',
     'D:/000004.jpg']

draw_tsne(x, y)
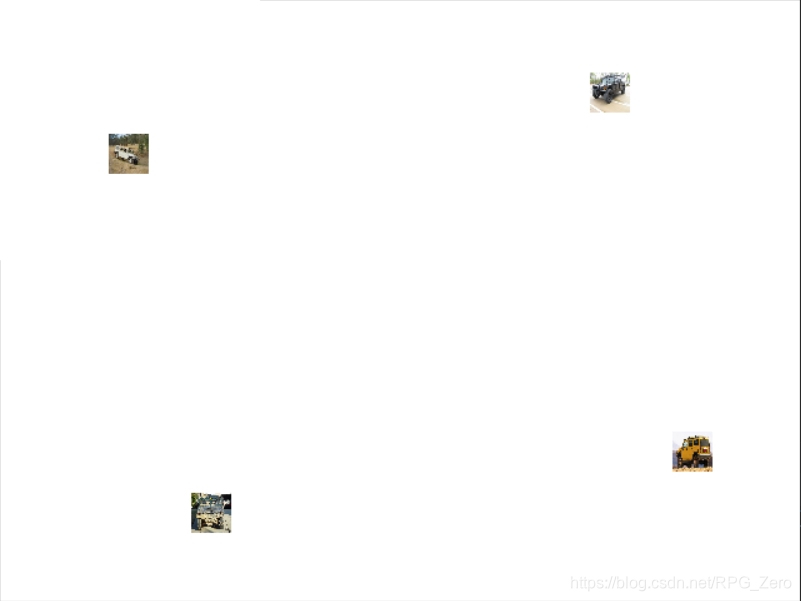
效果图:
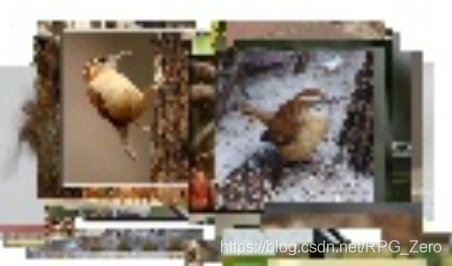
不过在使用相似代码对cub200数据集进行处理时,发现图片相互之间的遮挡情况十分严重,例如:
后来发现了一个python包:Embeddings2Image
瞬间被它的描述吸引:create "Karpathy's style" 2d images out of your image embeddings,但在win10环境下我一直没有配置成功,只在服务器上配置好了环境。
然鹅,我用主页上给出的样例代码跑出来的图片是一片黑。。。,最后根据它的源码仿写了几个函数,也发现了一些问题,笑哭.jpg
Scatter图
# scatter图  这个的处理是直接把跟之前的图片有遮挡部分的图片取消显示了 (。。。逃)
def scatter(projection_vectors, image_list):
    image_num = len(image_list)
    output_img_size = 4000  # 输出图片的大小
    each_img_size = 50
    tmp_vectors = projection_vectors * output_img_size
    image = np.ones((output_img_size + each_img_size, output_img_size + each_img_size, 3))
    for i in tqdm(range(image_num)):
        img_path = image_list[i]
        x0, y0 = map(int, tmp_vectors[i])
        small_img, x1, y1, dx, dy = get_image(img_path, each_img_size)
        if small_img is None:
            continue
        # test if there is an image there already
        if np.mean(image[y0 + dy:y0 + dy + y1, x0 + dx:x0 + dx + x1]) != 1:
            continue
        image[y0 + dy:y0 + dy + y1, x0 + dx:x0 + dx + x1] = small_img

    return image
辅助函数:
"""
img_tools.py
"""
import numpy as np
import cv2
from math import ceil


def standard_resize(image, max_side):
    if image is None:
        return None, None, None
    original_h, original_w, _ = image.shape
    # if all(side < max_side for side in [original_h, original_w]):
    #     return image, original_h, original_w
    aspect_ratio = float(np.amax((original_w, original_h)) / float(np.amin((original_h, original_w))))

    if original_w >= original_h:
        new_w = max_side
        new_h = max_side / aspect_ratio
    else:
        new_h = max_side
        new_w = max_side / aspect_ratio

    new_h = int(new_h)
    new_w = int(new_w)
    resized_image = cv2.resize(image, (new_w, new_h))
    return resized_image, new_w, new_h


def get_image(img_path, image_new_size):

    np_img = cv2.imread(img_path)
        # np_img = np.array(img)

    if np_img is None:
        return None, None, None, None, None

    small_image, x1, y1 = standard_resize(np_img, image_new_size)
    if small_image is None:
        return None, None, None, None, None

    dx = int(ceil((image_new_size - x1) / 2))
    dy = int(ceil((image_new_size - y1) / 2))
    return small_image, x1, y1, dx, dy
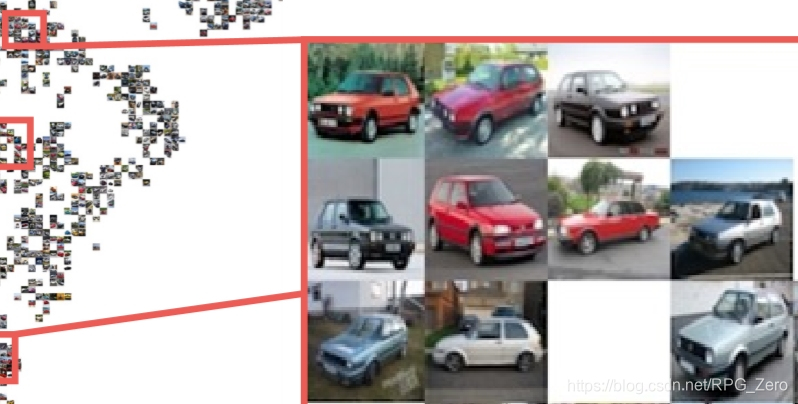
部分效果:

Grid图
写到这里,其实我最开始的想法是做一个grid图,图与图之间如果相连则刚好紧紧相连,不相连的话也会空出来相应的空间,类似于这样:
惊奇地发现也有类似的grid函数,仿写的函数如下(这部分我修改的还挺多的 主要是感觉它那个包里面的代码不太对劲 。。。 emmm 感觉错误蛮多的):
def grid(projection_vectors, image_list):
    #print(projection_vectors)
    output_img_size = 4000
    each_img_size = 50
    ratio = int(output_img_size / each_img_size)
    tsne_norm = projection_vectors * output_img_size
    print(tsne_norm)
    used_imgs = np.equal(projection_vectors[:, 0], None)
    image = np.ones((output_img_size + each_img_size, output_img_size + each_img_size, 3))
    for x in tqdm(range(ratio)):
        x0 = x * each_img_size
        x05 = (x + 0.5) * each_img_size
        y = 0
        while y < ratio:
            y0 = y * each_img_size
            y05 = (y + 0.5) * each_img_size
            tmp_tsne = tsne_norm - [x05, y05]
            #tmp_tsne[used_imgs] = 99999  # don't use the same img twice
            tsne_dist = np.hypot(tmp_tsne[:, 0], tmp_tsne[:, 1])
            min_index = np.argmin(tsne_dist)
            y += 1
            if used_imgs[min_index] == True:
                continue
            used_imgs[min_index] = True
            img_path = image_list[min_index]
            small_img, x1, y1, dx, dy = get_image(img_path, each_img_size)
            if small_img is None:
                continue
            image[y0 + dy:y0 + dy + y1, x0 + dx:x0 + dx + x1] = small_img

    return image
部分效果:

虽然跟想象中图片紧密挨着的情形差别还是蛮大的,但也先作为初步结果吧 hhhhh~
Example
from sklearn.manifold import TSNE
import cv2
import numpy as np
from tqdm import tqdm
from math import ceil
from img_tools import get_image


# 传入图像的embedding特征和对应的图像路径
def draw_tsne(features, imgs):
    """
    Args:
        feature: [n_samples  embed_dim], full data embedding of test samples.
        imgs:        list [n_samples], list of datapaths corresponding to <feature>
    """
    # 初始化一个TSNE模型,这里的参数设置可以查看SKlearn的官网
    tsne = TSNE(n_components=2, init='pca', perplexity=30)
    Y = tsne.fit_transform(features)
    #print(Y)
    # 归一化处理
    Y -= Y.min(axis=0)
    Y /= Y.max(axis=0)
    constructed_image = grid(Y, imgs)
    scatter_image = scatter(Y, imgs)
    cv2.imwrite('1.jpg', constructed_image)
    cv2.imwrite('2.jpg', scatter_image)
    # print(imgs)

# scatter图  这个的处理是直接把跟之前的图片有遮挡部分的图片取消显示了 (。。。逃)
def scatter(projection_vectors, image_list):
    image_num = len(image_list)
    output_img_size = 2500  # 输出图片的大小
    each_img_size = 50
    tmp_vectors = projection_vectors * output_img_size
    image = np.ones((output_img_size + each_img_size, output_img_size + each_img_size, 3))
    for i in tqdm(range(image_num)):
        img_path = image_list[i]
        x0, y0 = map(int, tmp_vectors[i])
        small_img, x1, y1, dx, dy = get_image(img_path, each_img_size)
        if small_img is None:
            continue
        # test if there is an image there already
        if np.mean(image[y0 + dy:y0 + dy + y1, x0 + dx:x0 + dx + x1]) != 1:
            continue
        image[y0 + dy:y0 + dy + y1, x0 + dx:x0 + dx + x1] = small_img

    return image


def grid(projection_vectors, image_list):
    #print(projection_vectors)
    output_img_size = 2500
    each_img_size = 50
    ratio = int(output_img_size / each_img_size)
    tsne_norm = projection_vectors * output_img_size
    print(tsne_norm)
    used_imgs = np.equal(projection_vectors[:, 0], None)
    image = np.ones((output_img_size + each_img_size, output_img_size + each_img_size, 3))
    for x in tqdm(range(ratio)):
        x0 = x * each_img_size
        x05 = (x + 0.5) * each_img_size
        y = 0
        while y < ratio:
            y0 = y * each_img_size
            y05 = (y + 0.5) * each_img_size
            tmp_tsne = tsne_norm - [x05, y05]
            #tmp_tsne[used_imgs] = 99999  # don't use the same img twice
            tsne_dist = np.hypot(tmp_tsne[:, 0], tmp_tsne[:, 1])
            min_index = np.argmin(tsne_dist)
            y += 1
            if used_imgs[min_index] == True:
                continue
            used_imgs[min_index] = True
            img_path = image_list[min_index]
            small_img, x1, y1, dx, dy = get_image(img_path, each_img_size)
            if small_img is None:
                continue
            image[y0 + dy:y0 + dy + y1, x0 + dx:x0 + dx + x1] = small_img

    return image


 671
671


 被折叠的 条评论
为什么被折叠?
被折叠的 条评论
为什么被折叠?
 到【灌水乐园】发言


