


spline
Cubic spline data interpolation
Syntax
s = spline(x,y,xq)
pp = spline(x,y)
Description
s = spline(x,y,xq)s corresponding to the query points in xq. The values of s are determined by cubic spline interpolation of x and y.
s = spline(x,y,xq)
xq是使用MATLAB画模拟信号图时,坐标轴的范围以及坐标点之间的间隔。这个间隔应该足够密集。
pp = spline(x,y)ppval and the spline utility unmkpp.
pp = spline(x,y)
Spline Interpolation of Sine Data
Use spline to interpolate a sine curve over unevenly-spaced sample points.
x = [0 1 2.5 3.6 5 7 8.1 10];
y = sin(x);
xx = 0:.25:10;
yy = spline(x,y,xx);
plot(x,y,'o',xx,yy)

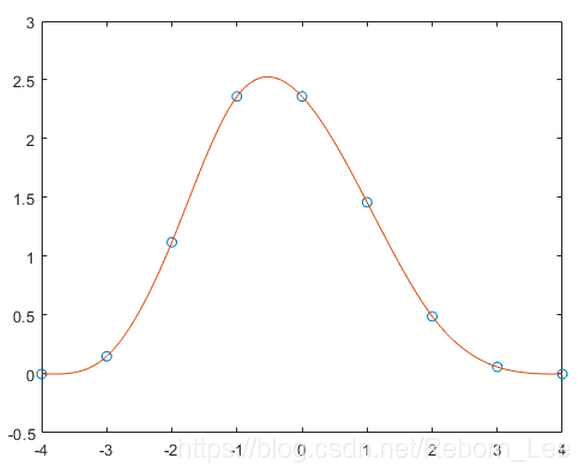
Spline Interpolation of Distribution with Specified Endpoint Slopes
Use clamped or complete spline interpolation when endpoint slopes are known. This example enforces zero slopes at the end points of the interpolation.
当已知端点斜率时,使用夹紧或完整的样条插值。 此示例在插值的结束点强制执行零斜率。
x = -4:4;
y = [0 .15 1.12 2.36 2.36 1.46 .49 .06 0];
cs = spline(x,[0 y 0]);
xx = linspace(-4,4,101);
plot(x,y,'o',xx,ppval(cs,xx),'-');
Extrapolation Using Cubic Spline
Extrapolate a data set to predict population growth.
Create two vectors to represent the census years from 1900 to 1990 (t) and the corresponding United States population in millions of people (p).
推断数据集以预测人口增长。
创建两个向量来表示1900年至1990年(t)的人口普查年和数百万人的相应美国人口(p)。
t = 1900:10:1990;
p = [ 75.995 91.972 105.711 123.203 131.669 ...
150.697 179.323 203.212 226.505 249.633 ];
Extrapolate and predict the population in the year 2000 using a cubic spline.
spline(t,p,2000)
![]()
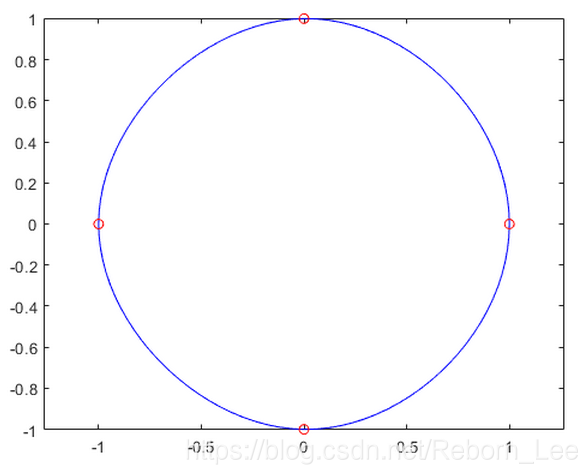
Spline Interpolation of Angular Data(角度数据的样条插值)
Generate the plot of a circle, with the five data points y(:,2),...,y(:,6) marked with o's. The matrix y contains two more columns than does x. Therefore, spline uses y(:,1) and y(:,end) as the endslopes. The circle starts and ends at the point (1,0), so that point is plotted twice.
生成一个圆的图,其中五个数据点y(:,2),...,y(:,6)用o标记。 矩阵y包含比x多两列的列。 因此,样条曲线使用y(:,1)和y(:,end)作为endslopes。 圆圈在点(1,0)处开始和结束,因此该点被绘制两次。
x = pi*[0:.5:2];
y = [0 1 0 -1 0 1 0;
1 0 1 0 -1 0 1];
pp = spline(x,y);
yy = ppval(pp, linspace(0,2*pi,101));
plot(yy(1,:),yy(2,:),'-b',y(1,2:5),y(2,2:5),'or')
axis equal
Spline Interpolation of Sine and Cosine Data
Use spline to sample a function over a finer mesh.
Generate sine and cosine curves for a few values between 0 and 1. Use spline interpolation to sample the functions over a finer mesh.
使用样条曲线在更精细的网格上对函数进行采样。
为0到1之间的几个值生成正弦和余弦曲线。使用样条插值在更精细的网格上对函数进行采样。
x = 0:.25:1;
Y = [sin(x); cos(x)];
xx = 0:.1:1;
YY = spline(x,Y,xx);
plot(x,Y(1,:),'o',xx,YY(1,:),'-')
hold on
plot(x,Y(2,:),'o',xx,YY(2,:),':')
hold off

Data Interpolation Using spline and pchip
Compare the interpolation results produced by spline and pchip for two different functions.
Create vectors of x values, function values at those points y, and query points xq. Compute interpolations at the query points using both spline and pchip. Plot the interpolated function values at the query points for comparison.
x = -3:3;
y = [-1 -1 -1 0 1 1 1];
xq1 = -3:.01:3;
p = pchip(x,y,xq1);
s = spline(x,y,xq1);
plot(x,y,'o',xq1,p,'-',xq1,s,'-.')
legend('Sample Points','pchip','spline','Location','SouthEast')
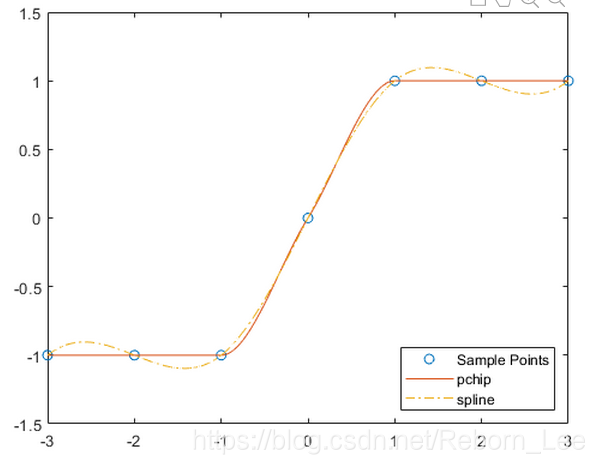
In this case, pchip is favorable since it does not oscillate as freely between the sample points.
Perform a second comparison using an oscillatory sample function.
x = 0:25;
y = besselj(1,x);
xq2 = 0:0.01:25;
p = pchip(x,y,xq2);
s = spline(x,y,xq2);
plot(x,y,'o',xq2,p,'-',xq2,s,'-.')
legend('Sample Points','pchip','spline')
When the underlying function is oscillatory, spline captures the movement between points better than pchip.


 4万+
4万+


 被折叠的 条评论
为什么被折叠?
被折叠的 条评论
为什么被折叠?
 到【灌水乐园】发言


