


SCADA data acquisition system, referred to as data acquisition system, is an indispensable system tool in the field of industrial control and industrial automation; traditional data acquisition systems generally use Labview software to obtain data by interacting with PLC and control systems , and then write it into the database, and finally display the data through the front-end page written in C# or VB; a slightly ideal way is to collect data through configuration software, such as KingView, and then through the report of KingView tools for display.
These two sets of solutions have disadvantages. For the first set of solutions, because the report components that come with Labview are simply horrible, they need to use multiple programming platforms for mixed programming, including Labview and C#. The required development cycle and the need to master Programming skills are relatively expensive in the solution, and because there are multiple platforms, the operation and maintenance cost is also the highest.
The second group of solutions, using third-party solutions such as Kingview, can meet the requirements, and the operation and maintenance costs are relatively low, but there are two problems in it. To achieve integration, the second is configuration software, which basically requires authorization.
Here is a method to quickly build a free SCADA data acquisition system through the open source project LECPServer. LECPServer is written in pure HTML+JS, so it can naturally use a large number of JS reporting tools and page display tools. This part of the tools, Compared with the desktop system of C#, it is quite rich.
Take a look at the charts display effects of d3js and echarts, it is not at the same level as the solution that comes with C#.


Let's take a look at how to build a free data acquisition system within 5 minutes through LECPServer.
1. Download LECPServer
We need to download the latest LECPServer from the LECPServer official website or Github page, download and try to run, if it can run successfully, you can go to the next step, if it can’t run, go to the official website to read the Windows runtime that needs to be downloaded and installed, and the installation is complete Then run it.
LECPServer Github Release :Releases · xeden3/LECPServer · GitHub
LECPServer official website :https://www.lecpserver.com
2. Add SCADA page
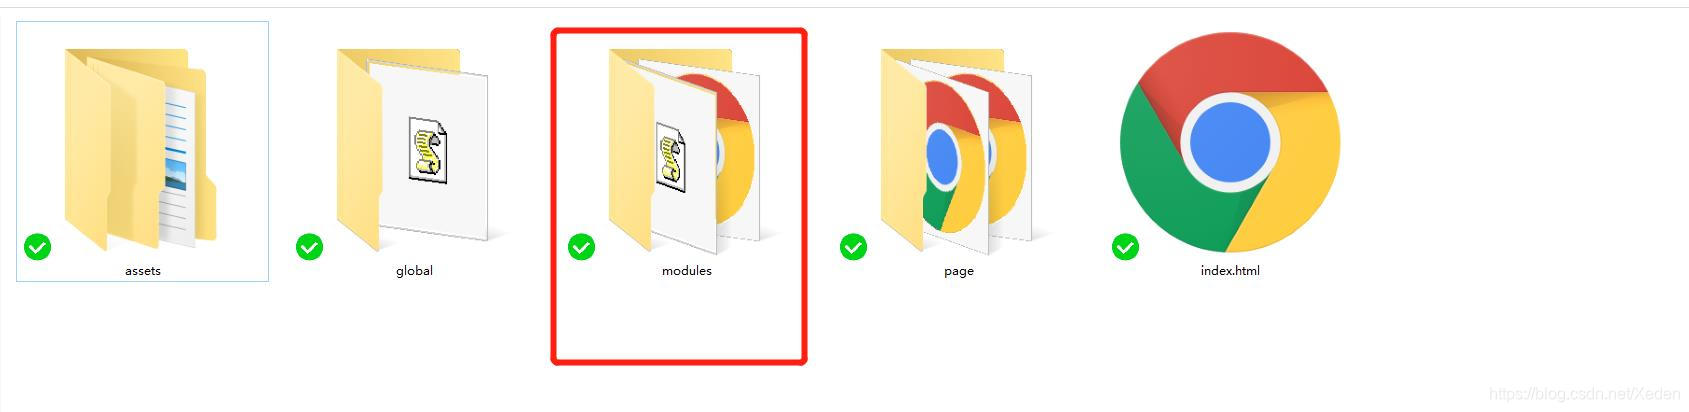
The second step is to start writing the page. We enter the bs folder (the latest bs folder can be downloaded from Github). The bs folder is full of source code, and the directory modules is the page module we need to add. Add two files, one is scada.html and the other is scada.js


We choose jQuery Sparklines to dynamically display the temperature change line graph of 32 points in two PLCs. The general display demo of jQuery Sparklines is as follows

Next we need to modify the code of scada.html and scada.js.
The following is the source code of scada.html
<!-- END PAGE BAR -->
<!-- BEGIN PAGE TITLE-->
<div name="main_page_scada">
    <h1 class="page-title"><span data-i18n="page_scada.title">SCADA Page</span>
        <small><span data-i18n="page_scada.subtitle">for LECPServer WebApi</span></small>
    </h1>
    <!-- END PAGE TITLE-->
    <!-- END PAGE HEADER-->
    <div class="row">
        <div class="col-md-12">
            <!-- BEGIN EXAMPLE TABLE PORTLET-->
            <div class="portlet light bordered">
                <div class="portlet-title">
                    <div class="caption font-dark">
                        <i class="icon-settings font-dark"></i>
                        <span class="caption-subject bold uppercase">SCADA</span>
                    </div>
                    <div class="tools"> </div>
                </div>
                <div class="portlet-body">
                    <div class="row" name="lable_chart_show">

                    </div>
                </div>
            </div>
        </div>
    </div>
</div>
Secondly, modify the home.html page under the page folder, and add the following code on line 360:
<li class="nav-item">
    <a href="javascript:;" class="nav-link nav-toggle" data-target="scada">
        <i class="fa fa-tv"></i>
        <span class="title" data-i18n="page_left_menu.scada">SCADA</span>
    </a>
</li>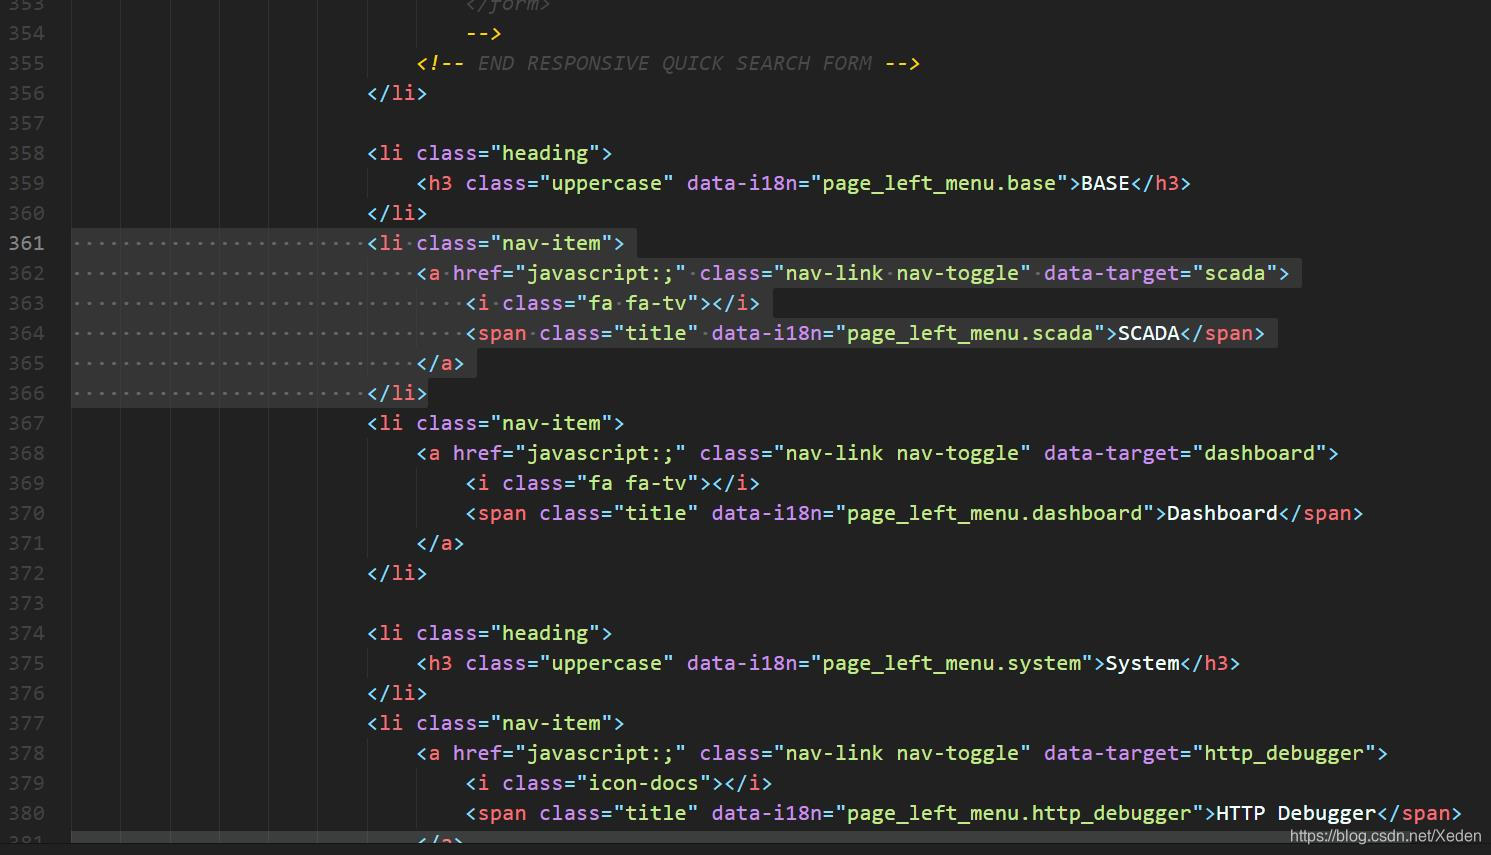
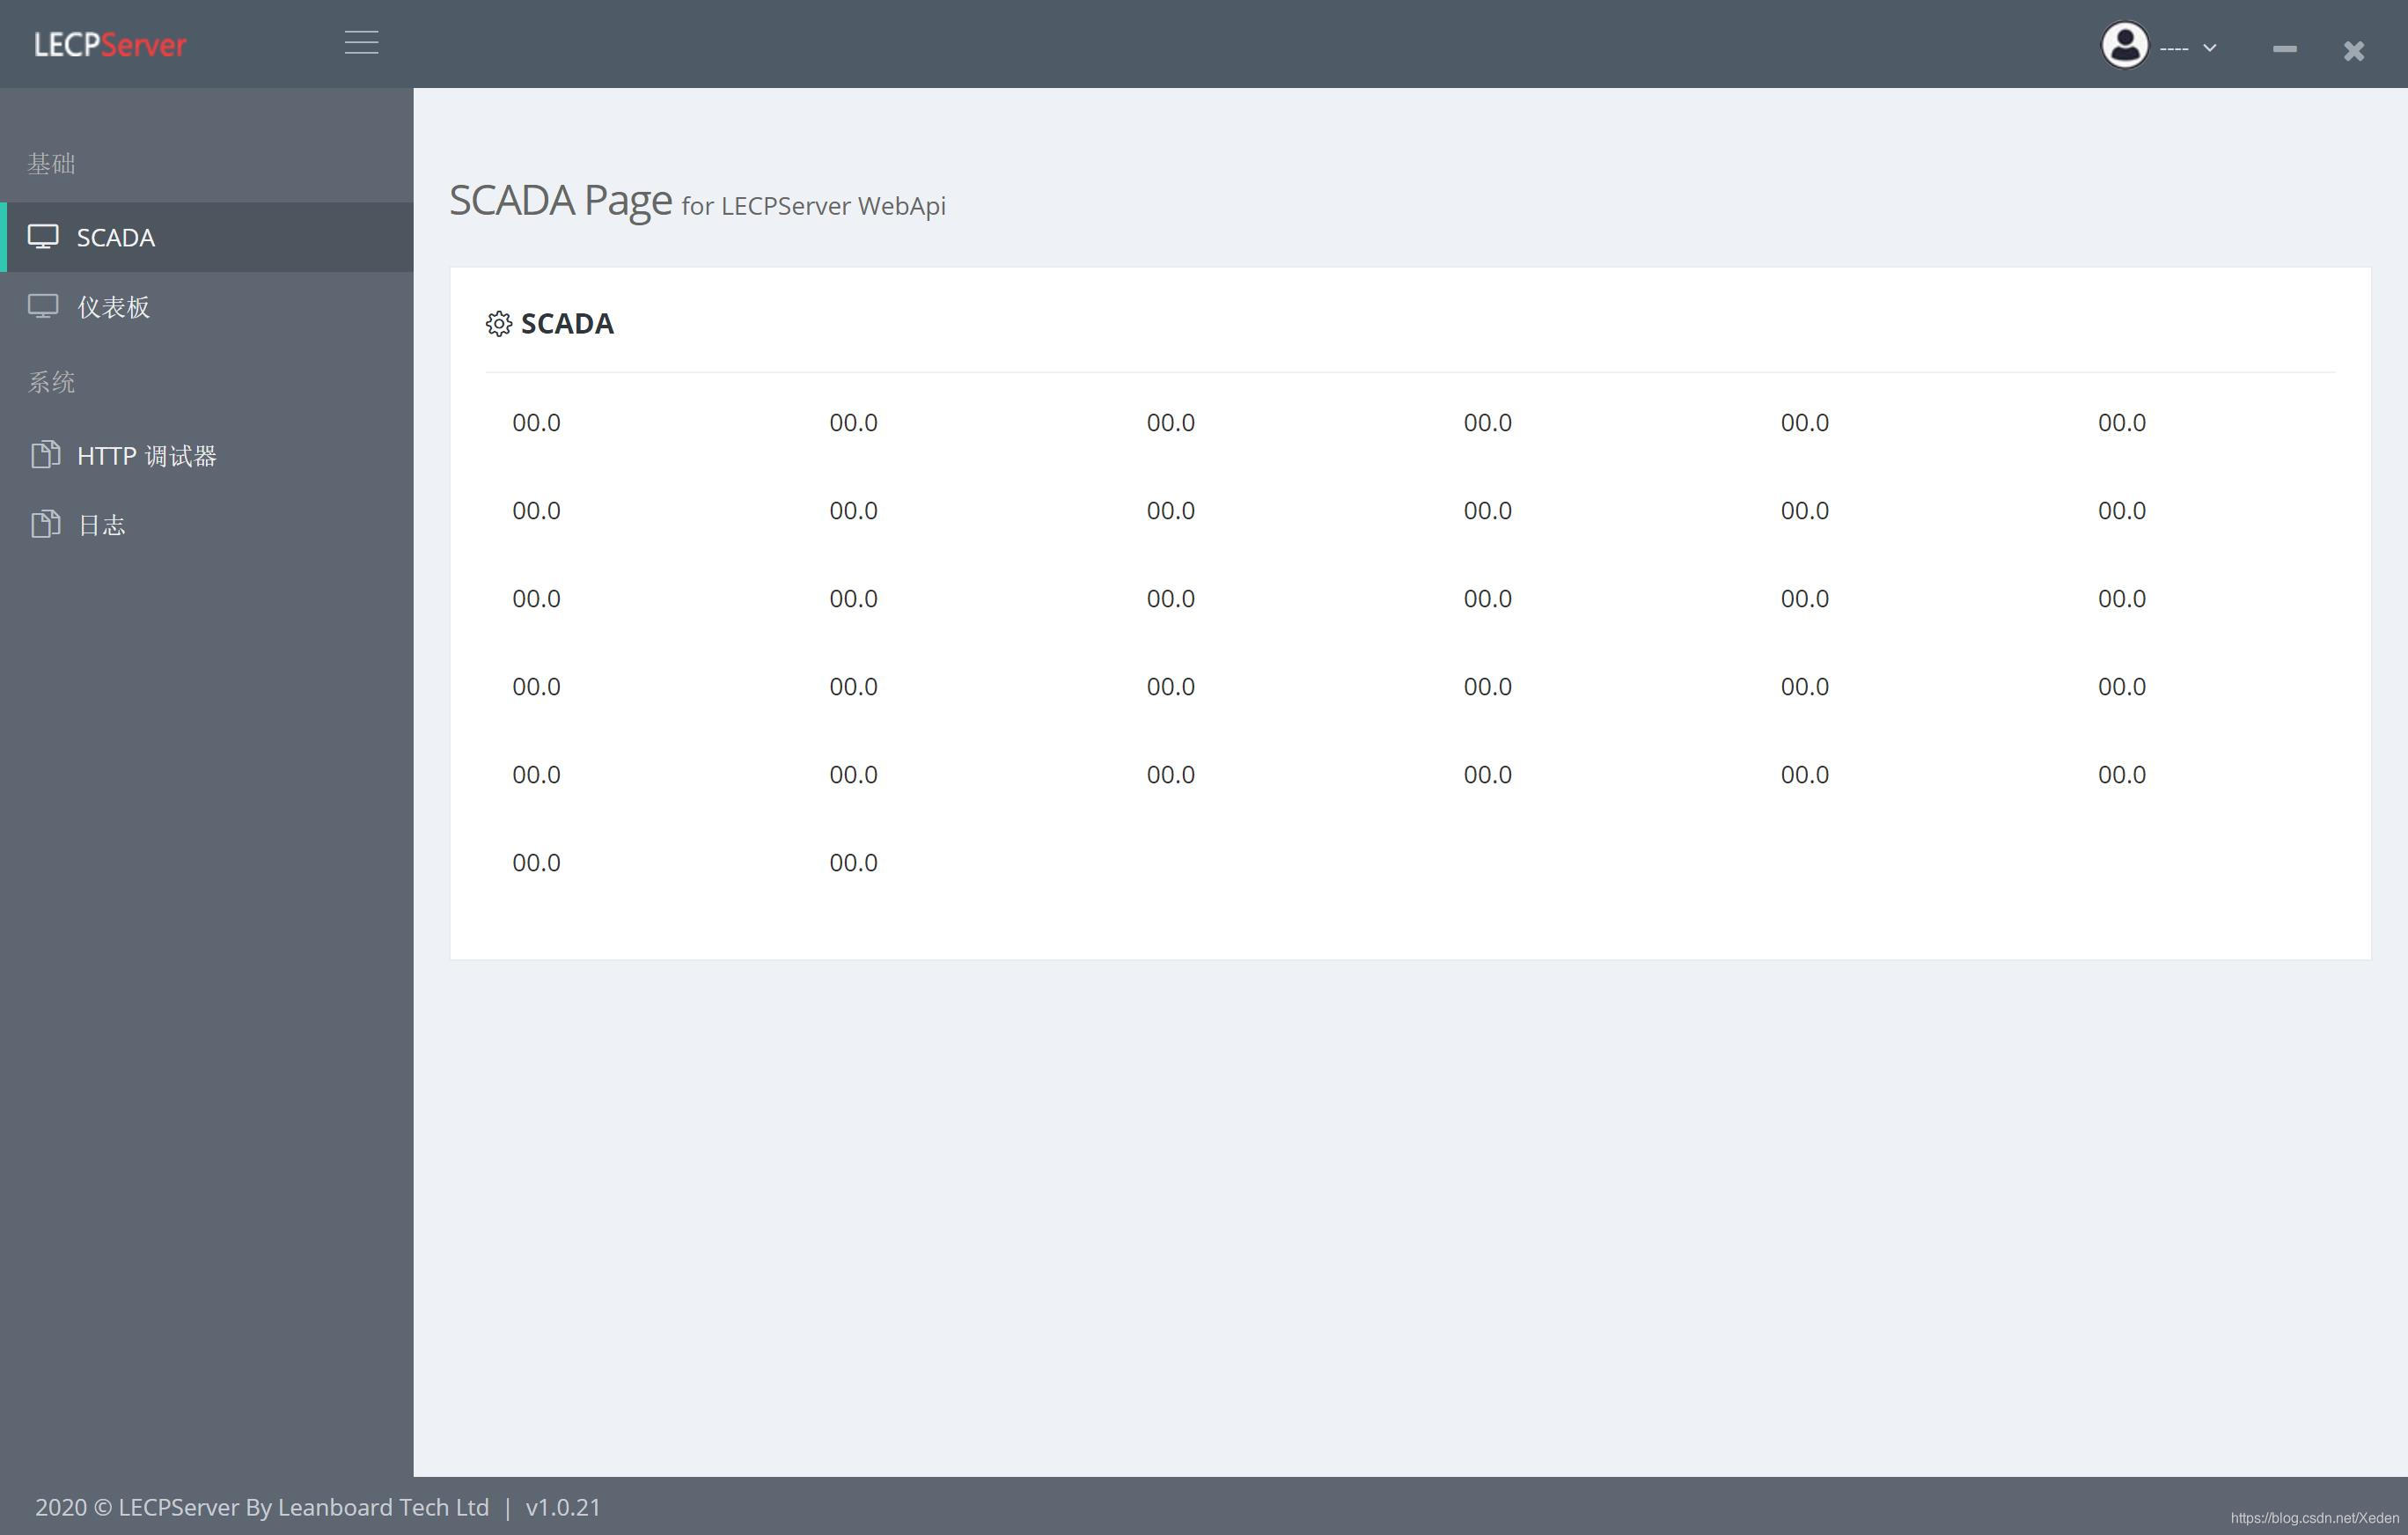
After opening the page code, you can see such an page.
3. Write SCADA code
Next, we began to write the implementation code of js. The js code uses the sparkline component to refresh the data collection data at a regular interval of 500ms.
The following is the source code of scada.js:
let m_temp_data = [];

function init_page() {
    // 初始化页面
    let html = "";
    for (let i = 0; i < 32; i++) {
        html += '<div class="col-md-2"><span class="col-md-3" name="lable_' + i + '">00.0</span><span class="col-md-9" name="temp_' + i + '"></span></div>'
    }
    $("[name='lable_chart_show']").html(html);

    // 设置32个温度点
    for (let i = 0; i < 32; i++) {
        m_temp_data[i] = [0];
        $("[name='temp_" + i + "']").sparkline(m_temp_data[i], { type: 'line', height: '50', normalRangeMin: 0 });
    }

}

init_page();

setInterval(function () {
    // 每500ms进行一次温度刷新
    for (let dev in g_plc_data['NODES']) {
        for (let node in g_plc_data['NODES'][dev]) {
            // 获取节点的值
            let v = g_plc_data['NODES'][dev][node]['value'];
            $("[name='lable_" + node + "']").html(v[0].toFixed(1));
            m_temp_data[parseInt(node)] = m_temp_data[parseInt(node)].slice(-20);
            m_temp_data[parseInt(node)].push(v[0])
        }
    }
    for (let i = 0; i < 32; i++) {
        // 分别刷新32个温度点的值
        $("[name='temp_" + i + "']").sparkline(m_temp_data[i], { type: 'line', height: '50', normalRangeMin: 0 });
    }
}, 500);


//# sourceURL=scada.js
4. Configure the PLC node
After we have finished writing the code, we can add devices and nodes to the PLC. This time we are using Siemens S1500 PLC, connected to 22 low-precision sensors, and the addresses of the sensors are from M100 to M2200
The configuration page is as follows:
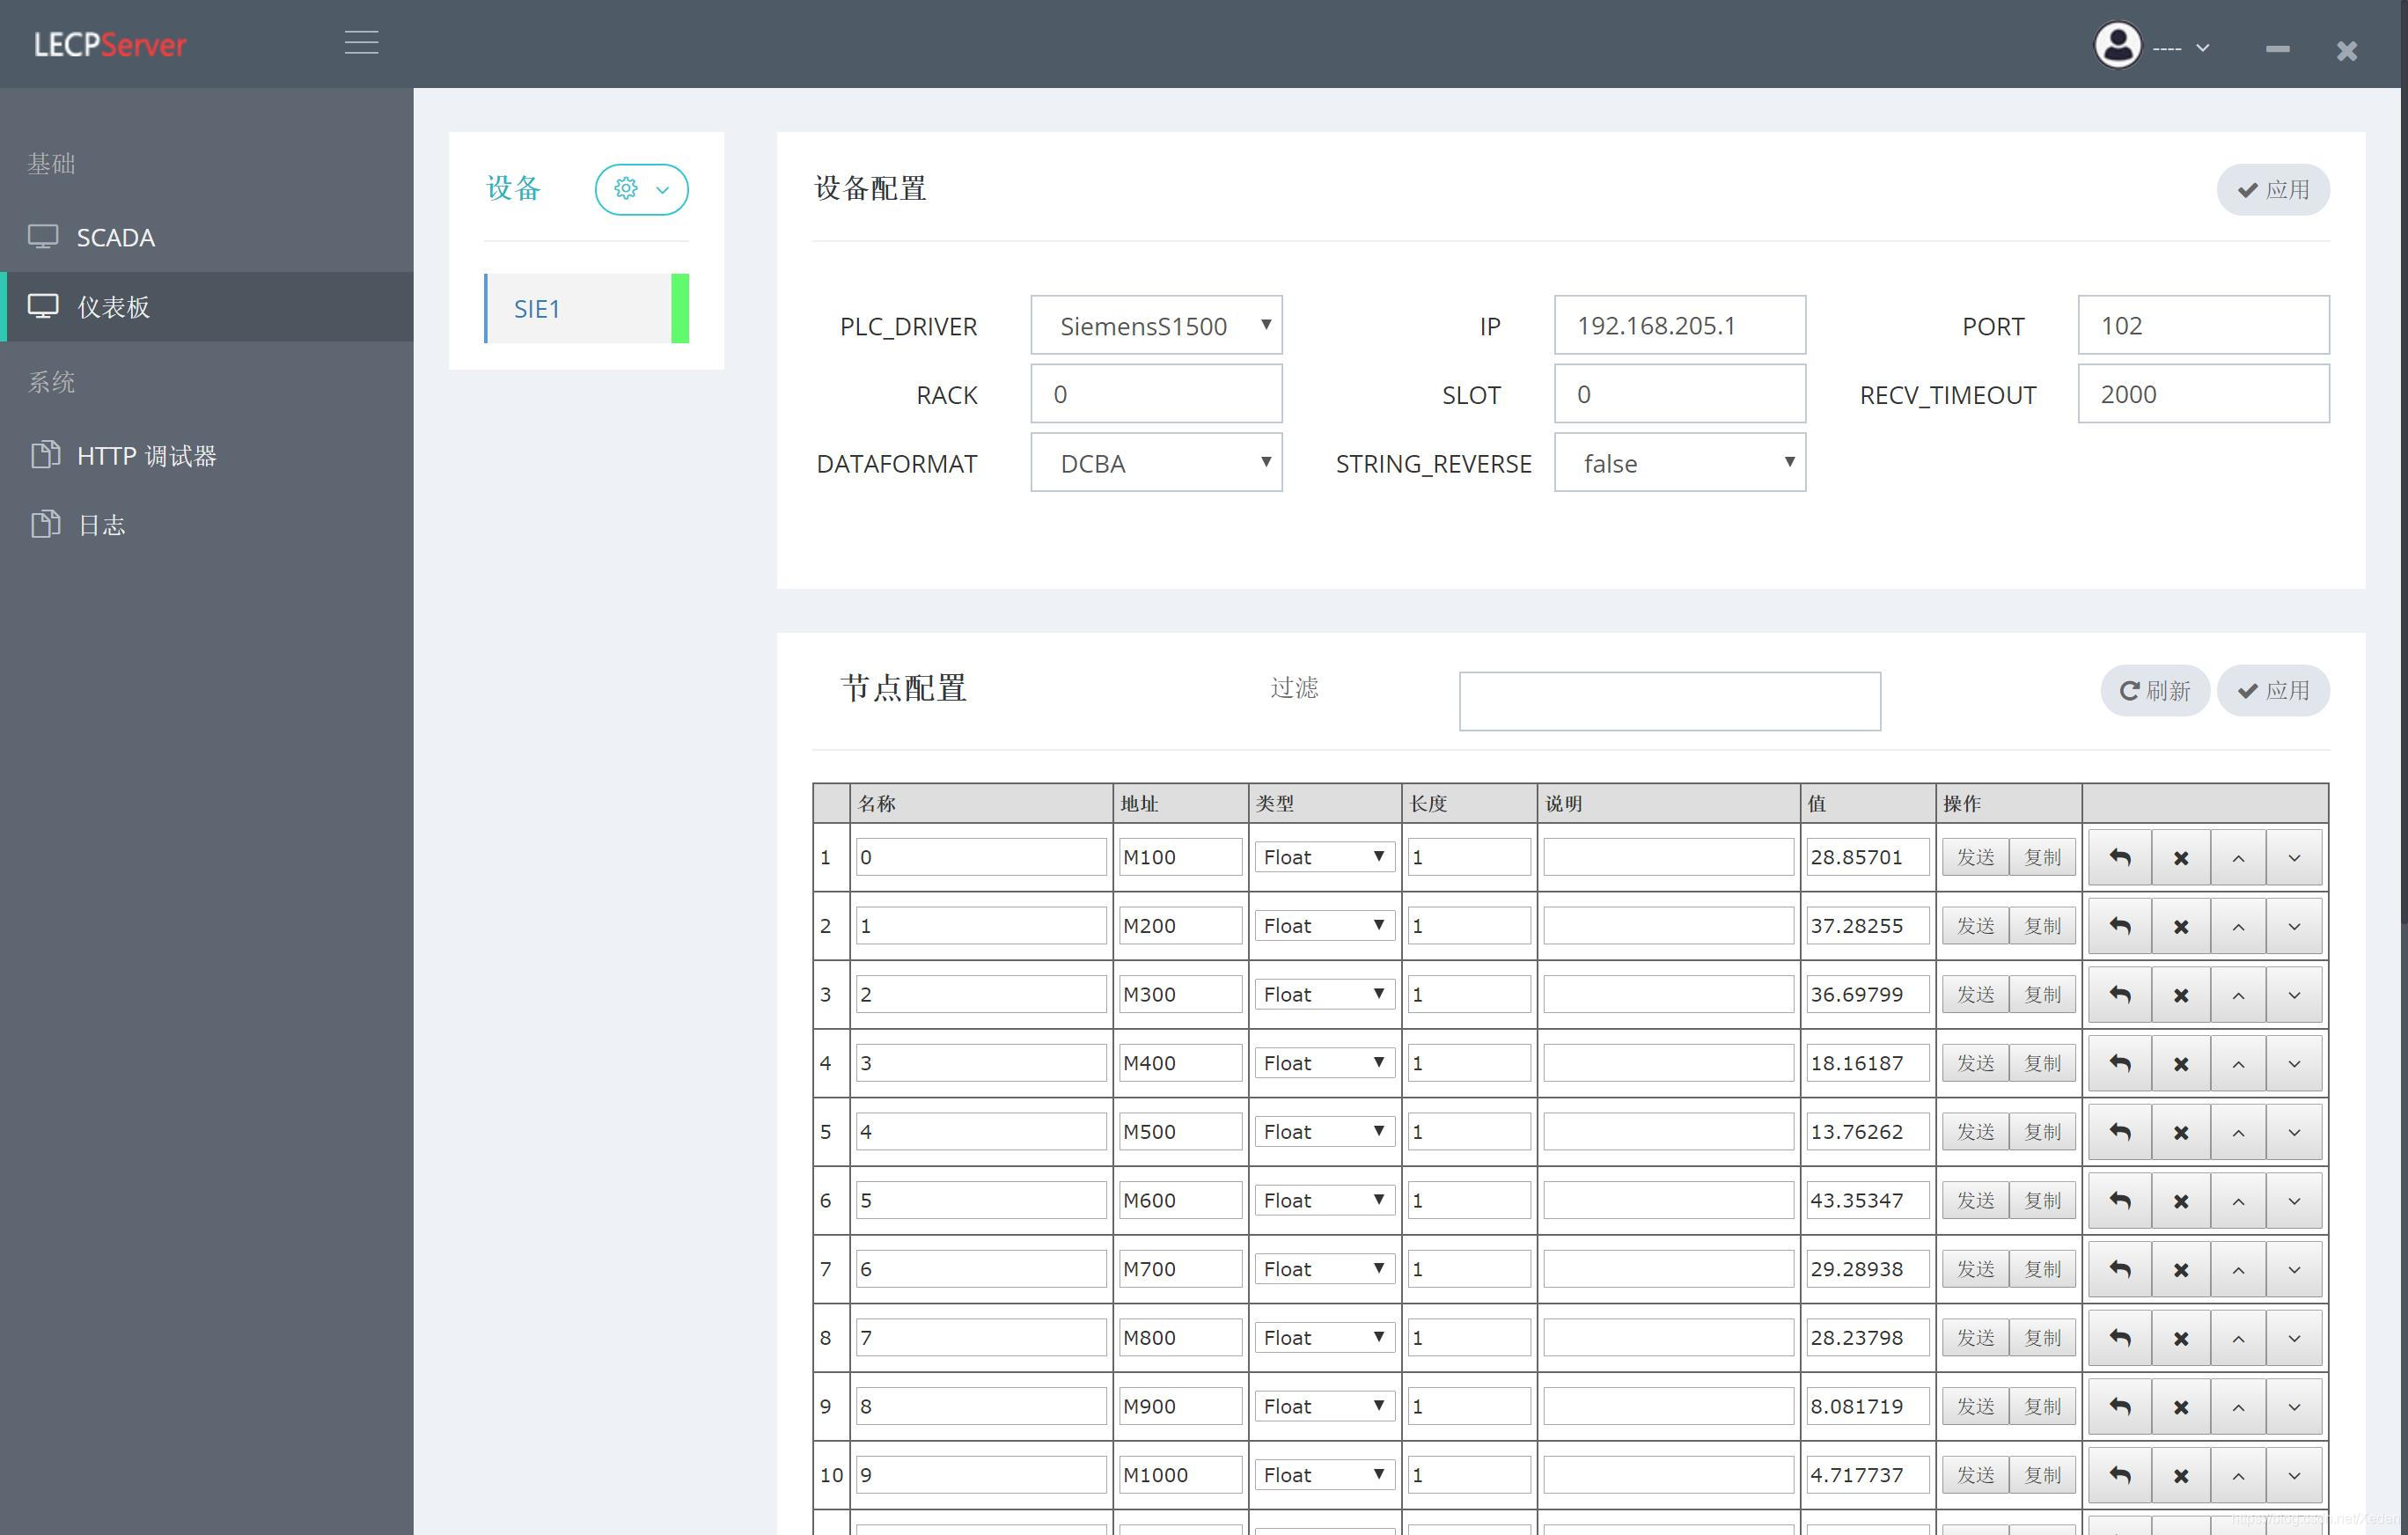
Click Apply, so that you can see the sampling information, and then click to the SCADA page, we can see the effect as follows:
In this way, we have completed a free SCADA system.
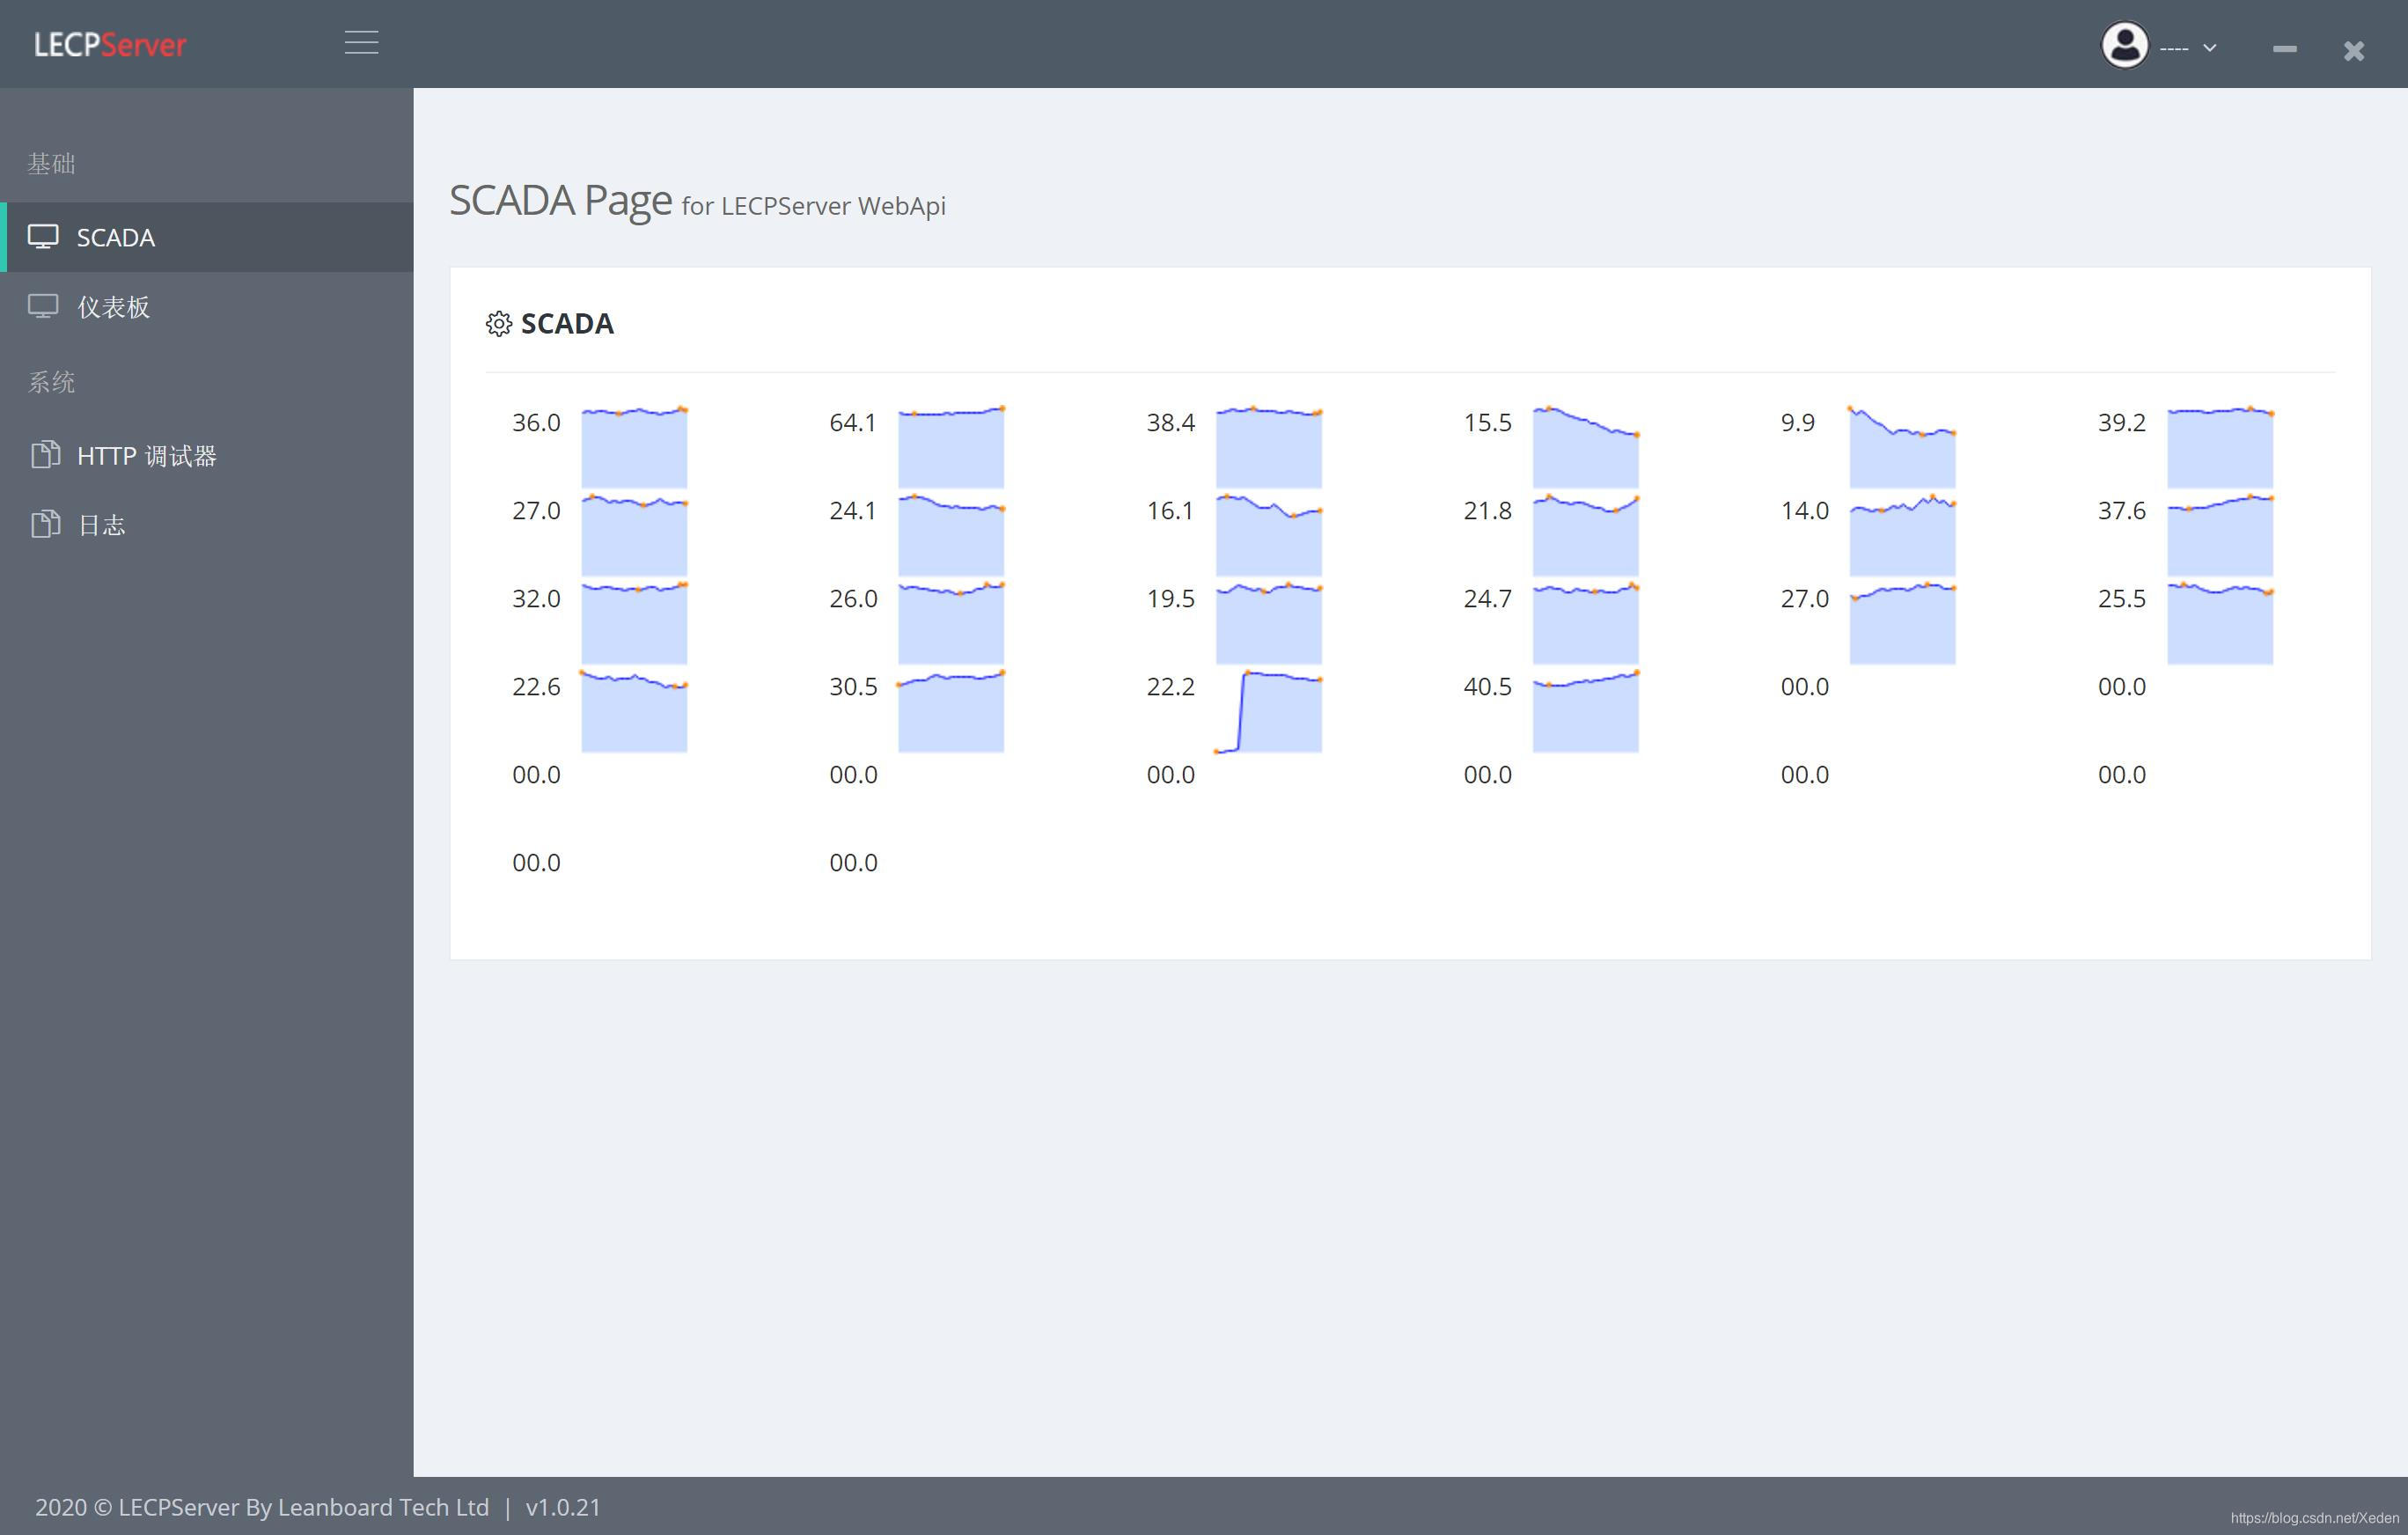
The following picture is the display effect of GIF, you can see that the sensor data is refreshed every 500ms


 1万+
1万+


 被折叠的 条评论
为什么被折叠?
被折叠的 条评论
为什么被折叠?
 到【灌水乐园】发言


