


#!/usr/bin/python
#coding: utf-8
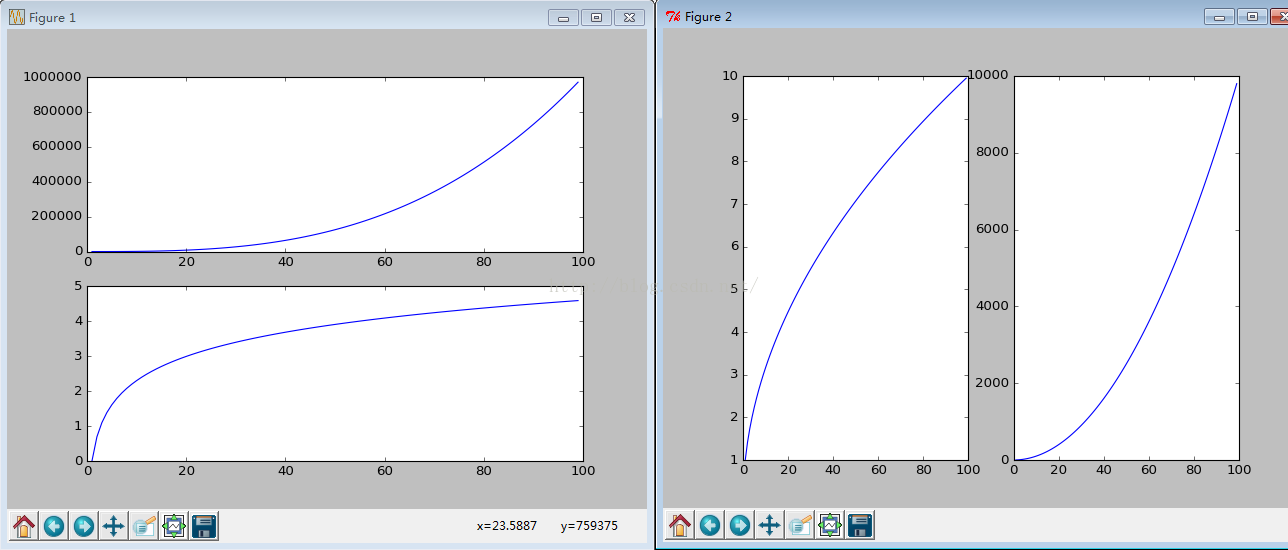
# 创建两个图(figure),每个图中都存在两个子图(add_subplot),一个是一行两列的,一个是两行一列的
import numpy as np
import matplotlib.pyplot as plt
x = np.arange(1, 100)
fig1 = plt.figure()
ax1 = fig1.add_subplot(211)
ax1.plot(x, x ** 3)
ax2 = fig1.add_subplot(212)
ax2.plot(x, np.log(x))
fig2 = plt.figure()
ax2 = fig2.add_subplot(121)
ax2.plot(x, np.sqrt(x))
ax4 = fig2.add_subplot(122)
ax4.plot(x, x ** 2)
plt.show()


 8275
8275


 被折叠的 条评论
为什么被折叠?
被折叠的 条评论
为什么被折叠?
 到【灌水乐园】发言


