


代码中的相关参数
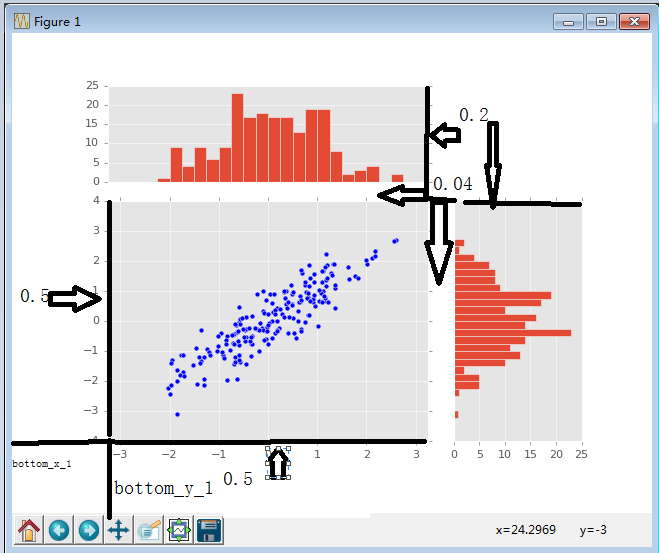
使用的主要是面向对象中的 add_axes 方法,注意三个图形中的坐标进行对应,画出的散点图,在另外两个子图中画出对应的柱状图
#!/usr/bin/python
#coding: utf-8

import numpy as np
import matplotlib.pyplot as plt

plt.style.use("ggplot")

fig = plt.figure()

# 画主图
bottom_x_1 = 0.15
bottom_y_1 = 0.15
width = 0.5
height = 0.5

rect1 = [bottom_x_1, bottom_y_1, width, height]
ax1 = fig.add_axes(rect1)

# 两个子图的坐标值需要注意

# 画最上方子图, 不需要 x 轴
bottom_x = bottom_x_1
bottom_y = bottom_y_1 + height + 0.04
width = width
height = 0.2

rect2 = [bottom_x, bottom_y, width, height]
ax2 = fig.add_axes(rect2, xticks = [])

# 画右方子图, 不需要 y 轴
bottom_x = bottom_x_1 + width + 0.04
bottom_y = bottom_y_1
width = 0.2
height = 0.5

rect3 = [bottom_x, bottom_y, width, height]
ax3 = fig.add_axes(rect3, yticks = [])

# y 与 x 正相关
x = np.random.randn(200)
y = x + np.random.randn(200) * 0.5
ax1.scatter(x, y)

# 把柱状图中的宽度都设置成0.25
bin_width = 0.25
# 获取它的xy最大的坐标,得到的xymax是相对于原点来说的
xymax = np.max([np.max(np.fabs(x)), np.max(np.fabs(y))])
# 设置子图能够平均分成多少块, 这样得到的lim能够整除bin_width
# 加1是为了避免四舍五入的影响
lim = int(xymax / bin_width + 1) * bin_width
# print lim
# 设置x轴坐标
ax1.set_xlim(-lim, lim)

bins = np.arange(-lim, lim + bin_width, bin_width)

# 画柱状图
ax2.hist(x, bins= bins)
ax3.hist(y, bins= bins, orientation = "horizontal")

# 设置上方的图和右方的图与主图对应
ax2.set_xlim(ax1.get_xlim())
ax3.set_ylim(ax1.get_ylim())

plt.show()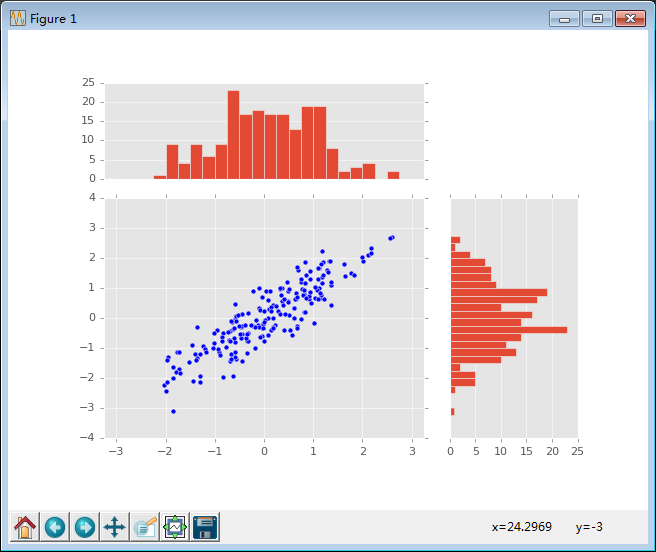


 939
939

 被折叠的 条评论
为什么被折叠?
被折叠的 条评论
为什么被折叠?
 到【灌水乐园】发言


