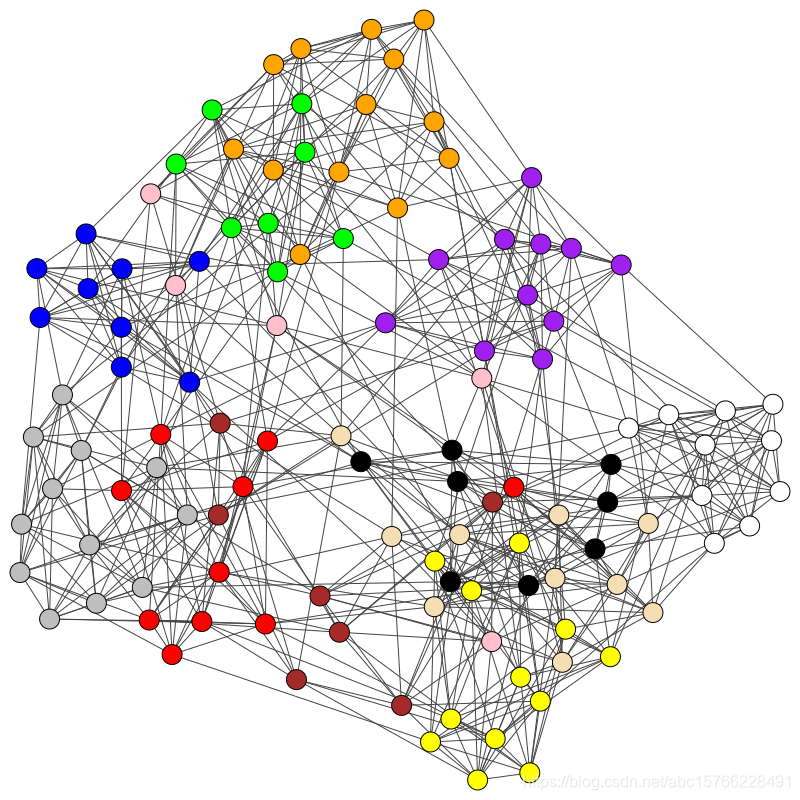
igraph是一个用来绘制网络图的库,下面用football.gml文件举例,说明如何使用这个库。如有纰漏,望指正。
g = igraph. Graph. Read_GML( filePath)
'''
@classmethod
def Read_GML(cls, f): # real signature unknown; restored from __doc__
"""
Read_GML(f)
Reads a GML file and creates a graph based on it.
@param f: the name of the file or a Python file handle
"""
pass
'''
g. vs[ 'label' ] = [ '' ]
def getValue ( value) :
colorList = [ 'blue' , 'green' , 'purple' , 'yellow' , 'red' , 'pink' , 'orange' , 'black' , 'white' , 'gray' , 'brown' , 'wheat' ]
return colorList[ int ( value) ]
visual_style = dict ( )
visual_style[ 'vertex_color' ] = list ( map ( getValue, ( g. vs[ 'value' ] ) ) )
plot ()的注释,可以得到visual_style全部的可以设置的属性,这里就不一一列举了igraph. plot( g, ** visual_style)
import igraph
filePath = 'file/football.gml'
imagePath = 'file/footbalImage.png'
def getValue ( value) :
colorList = [ 'blue' , 'green' , 'purple' , 'yellow' , 'red' , 'pink' , 'orange' , 'black' , 'white' , 'gray' , 'brown' , 'wheat' ]
return colorList[ int ( value) ]
g = igraph. Graph. Read_GML( filePath)
g. vs[ 'label' ] = [ '' ]
visual_style = dict ( )
visual_style[ 'vertex_color' ] = list ( map ( getValue, ( g. vs[ 'value' ] ) ) )
visual_style[ 'bbox' ] = [ 0 , 0 , 800 , 800 ]
image = igraph. plot( g, ** visual_style)
image. save( imagePath)


 1637
1637


 被折叠的 条评论
为什么被折叠?
被折叠的 条评论
为什么被折叠?
 到【灌水乐园】发言


