


在开发系统的时候有许多数据分析需要用图形的方式来表现出,这样更直观又清淅。如果我们使用高级去动态
生成统计图表的话不但编写起来非常困难,而且实用性不是很好,从美观的角度上讲也是很设计的。然而Microsoft公司提供了一个专们的矢量画图语言,这就是VML.
如果要用VML去画静态页面的话那是比较好看也好操作,但实用性不是很高。但要是画出来的图所表示的数据
是从数据库里面读取下来的可以动态表示要统计的内容的话,那实用性就不言而喻了。
最近我们也要做一个数据统计图表,我想如果能把VML画图做成一个控件那该多很,做自定义控件(本人才疏学浅)我不怎么会做,但我们公司有个.NET很牛 的人,我经常看到他重写.net里自带的控件使这些控件变得更好用,于是我也产生一种想法,看能不能把VML也嵌套进去.结果做的还是有点起色.下面跟大 家分享一下.
我是把VML图表用Lable控件显示出来的,给Lable类添加了一些自定义属性.(在下面的代码里面有的属性还没有用到用与以后扩展)
页面代码如下
<%
@ Page Language
=
"
C#
"
AutoEventWireup
=
"
true
"
CodeFile
=
"
DrawTest.aspx.cs
"
Inherits
=
"
DrawTest
"
%>
< html xmlns:v ="urn:schemas-microsoft-com:vml" xmlns:o ="urn:schemas-microsoft-com:office:office"
xmlns ="http://www.w3.org/1999/xhtml" >
< head id ="Head1" runat ="server" >
< title > Page </ title >
< style type ="text/css" >
v\:* { behavior : url(#default#VML) }
o\:* { behavior : url(#default#VML) }
.changeBg { FILTER : progid:DXImageTransform.Microsoft.Gradient(gradientType=0,startColorStr=#FFFFFF,endColorStr=#9DCDFA) ;
}
.shadwDiv { width : 600px ; height : 500px ; text-align : center ; filter : progid:DXImageTransform.Microsoft.DropShadow ( enabled=true , color=#000 , offX=10 , offY=10 , positive=true ) ; }
</ style >
</ head >
< body >
< form id ="form1" runat ="server" >
< div class ="shadwDiv" >
< div style ="padding-top: 30px; border: solid 2px #BBBBBB; background-color: #EFEFEF;
width: 600px; height: 500px;" >
< asp:VmlLabel ID ="labTest3" runat ="server" XWidth ="400" YHeight ="400" YPosition ="50"
IsDrawVML ="True" BgDistance ="10" EnableViewState ="False" ZhuWidth ="20" YItemWidth ="40"
CssClass ="changeBg" BorderColor ="White" BorderWidth ="0px" LineColor ="#4CAFFE"
XSign ="(年份)" YSign ="(万/单位)" XPosition ="50" IsZhuOrBing ="Zhu" Redii ="80" ></ asp:VmlLabel >
</ div >
</ div >
</ form >
</ body >
</ html >
这里面的.<html>标签里的” xmlns:v="urn:schemas-microsoft-com:vml" xmlns:o="urn:schemas-microsoft-com:office:office"
”和. v\:*{ behavior: url(#default#VML) }
o\:*{ behavior: url(#default#VML) }
是必不可少的.
下面是CS代码部分
private
int
xposition;
private int yposition;
private int xwidth;
private int yheight;
private bool isdrawVML;
private int bgdistance; // 背景距离(斜线之间的垂直距离)
private int zhuWidth;
private string lineColor;
private int yItemWidth;
private string xSign; // X轴标记
private string ySign; // Y轴标记
private List < VmlDataSource > datasource;
private IszhuOrBing isZhuOrBing;
private int radii; // 画饼图要用的半径
public IszhuOrBing IsZhuOrBing
{
get { return isZhuOrBing; }
set { isZhuOrBing = value; }
}
#region 属性的定义
/// <summary>
/// 画饼图的半径
/// </summary>
public int Redii
{
get { return radii; }
set { radii = value; }
}
/// <summary>
/// X轴的位置
/// </summary>
public int XPosition
{
get { return xposition; }
set { xposition = value; }
}
/// <summary>
/// Y轴位置
/// </summary>
public int YPosition
{
get { return yposition; }
set { yposition = value; }
}
//
/// <summary>
/// X轴宽度
/// </summary>
public int XWidth
{
get { return xwidth; }
set { xwidth = value; }
}
//
/// <summary>
/// Y轴高度
/// </summary>
public int YHeight
{
get { return yheight; }
set { yheight = value; }
}
/// <summary>
/// 是否是画VML图
/// </summary>
public bool IsDrawVML
{
get { return isdrawVML; }
set { isdrawVML = value; }
}
/// <summary>
/// 背景距离(斜线之间的垂直距离)
/// </summary>
public int BgDistance
{
get
{
return bgdistance;
}
set
{
if (value <= 0 )
bgdistance = 10 ;
else
bgdistance = value;
}
}
/// <summary>
/// 柱子的宽度
/// </summary>
public int ZhuWidth
{
get { return zhuWidth; }
set { zhuWidth = value; }
}
/// <summary>
/// 柱子的颜色
/// </summary>
public string LineColor
{
get { return lineColor; }
set { lineColor = value; }
}
/// <summary>
/// Y轴方向的间距
/// </summary>
public int YItemWidth
{
get { return yItemWidth; }
set { yItemWidth = value; }
}
/// <summary>
/// X轴标识
/// </summary>
public string XSign
{
get { return xSign; }
set { xSign = value; }
}
/// <summary>
/// Y轴标识
/// </summary>
public string YSign
{
get { return ySign; }
set { ySign = value; }
}
/// <summary>
/// 数据源(柱子高度)
/// </summary>
public List < VmlDataSource > DataSource
{
get { return datasource; }
set { datasource = value; }
}
#endregion
判断是画柱图还是饼图.
// 画VML图
StringBuilder sbText = new StringBuilder();
string strHeight = "" ;
string strTop = "" ;
public void DrawVml()
{
if (isdrawVML == true )
{ //
if (isZhuOrBing == IszhuOrBing.Bing)
{
DrawBingImage();
}
else if (isZhuOrBing == IszhuOrBing.Zhu)
{
DrawZhuImage();
}
}
}
*** IsZhuOrBing是一个自定义的枚举类型.
// 柱子一升的脚本
private string RegisterScript()
{
string m_strScript = " <script language='javascript' type='text/javascript'> "
+ " var gao=0; "
+ " var ProcID=0; "
+ " var ProcName=null; "
+ " var i=0; "
+ " var HeightContent=document.getElementById('heightDataSource').value; "
+ " var arrHeight=new Array(); "
+ " var arrTop=new Array(); "
+ " arrHeight=HeightContent.split(','); "
+ " var showBar=null; "
+ " function AllPlay() "
+ " { "
+ " i++; "
+ " gao=0; "
+ " var procBarID='DataZhu'+i; " // ;
+ " Play(procBarID); "
+ " } "
+ " function Play(procBarID) "
+ " { "
+ " var procBar=document.getElementById(procBarID); "
+ " if(procBar!=null) "
+ " { "
+ " ProcName=procBar; "
+ " PlaySub(); "
+ " } "
+ " } "
+ " function PlaySub() "
+ " { "
+ " var procBar=ProcName; "
+ " showBar=document.getElementById('ShowData'+i); "
+ " showBar.style.display='block'; "
+ " gao++; "
+ " var ygao=parseInt(procBar.style.height); "
+ " var ytop=parseInt(procBar.style.top); "
+ " if(ygao<arrHeight[i-1]) "
+ " { "
+ " procBar.style.top=ytop-gao; "
+ " procBar.style.height=ygao+gao; "
+ " showBar.style.top=ytop-gao-25; "
+ " setTimeout(PlaySub,20); "
+ " } "
+ " else "
+ " { "
+ " AllPlay(); "
+ " } "
+ " } "
+ " </script> " ;
return m_strScript;
}
上面的那段代码是要向客户端注册的JS脚本用于,画柱图时渐长效果的.
开始画VML图
// 画柱图.
public void DrawZhuImage()
{
base .Text = "" ;
// 画Div
// sbText.Append("<div style=' border:solid 1px red;width:" + (xwidth+10) + "; height:" + (yheight+10) + ";;filter : progid:DXImageTransform.Microsoft.DropShadow ( enabled=true , color=#66333333 , offX=4 , offY=4 , positive=true );'>");
sbText.Append( " <div id='PicDiv' style='left:0;position:relative; top:0; width: " + xwidth + " ; height: " + yheight + " ;text-align:left;'> " );
// base.Style.Value = "left:" + xposition + ";position:relative; top:" + yposition + "; width:" + (xwidth+20) + "; height:" + (20+yheight) + ";'";
// 画X轴
sbText.Append( " <v:line id='Xzhou' from='0, " + yheight + " ' to=' " + xwidth + " , " + yheight + " '> "
+ " <v:stroke EndArrow='Classic'/></v:line><v:TextBox style='position:absolute; width:100px;top: " + (yheight + 10 ) + " ;left: " + (xwidth) + " '> " + xSign + " </v:TextBox> " );
// 画X轴方向的线条
int HaveData = ComputeX(xwidth);
// if (HaveData == 0)
// {
// sbText.Append("</div>");
// base.Text = sbText.ToString(0, sbText.Length);
// return;
// }
// 画Y轴
sbText.Append( " <v:line id='Yzhou' from='0, " + yheight + " ' to='0,0'><v:stroke EndArrow='Classic'/><v:TextBox style=' width:100px;padding-left:10px;'> " + ySign + " </v:TextBox></v:line> " );
// 画Y轴方向的线条
ComputeY(yheight);
// 画DIV结束标记
sbText.Append( " </div> " );
// 画隐形文本框
sbText.Append( " <input type='hidden' value=' " + strHeight.Substring( 0 , strHeight.Length - 1 ) + " ' name='heightDataSource' id='heightDataSource'/> " );
sbText.Append( " <input type='hidden' value=' " + strTop.Substring( 0 , strTop.Length - 1 ) + " ' name='topDataSource' id='topDataSource'/> " );
// 给Lable控件的Text赋值
base .Text = sbText.ToString( 0 , sbText.Length);
Page.RegisterStartupScript( " zhuup " , RegisterScript());
}
//
private int ComputeX( int XWidth)
{ // 柱子颜色数组
string [,] ZColor = new string [ 6 , 2 ];
ZColor[ 0 , 0 ] = " #666699 " ; ZColor[ 0 , 1 ] = " #d9d9e5 " ;
ZColor[ 1 , 0 ] = " #00ff00 " ; ZColor[ 1 , 1 ] = " #d1ffd1 " ;
ZColor[ 2 , 0 ] = " #ff0000 " ; ZColor[ 2 , 1 ] = " #ffbbbb " ;
ZColor[ 3 , 0 ] = " #ff9900 " ; ZColor[ 3 , 1 ] = " #ffe3bb " ;
ZColor[ 4 , 0 ] = " #33cccc " ; ZColor[ 4 , 1 ] = " #cff4f3 " ;
ZColor[ 5 , 0 ] = " #993300 " ; ZColor[ 5 , 1 ] = " #ffc7ab " ;
XWidth -= 10 ; // 箭头下面的长度
int ColorIndex = 0 ;
double height = 0 ;
int Zhuposition = 0 ;
int Count = this .DataSource == null ? XWidth: this .DataSource.Count;
int num = 1 ;
// Count = 0;
// if (Count == 0)
// {
// sbText.Append("<div style='font-size:14px;color:red;'>暂无数据</div>");
// return 0;
// }
int UnitLength = XWidth / Count; // 计算单位长度
foreach (VmlDataSource var in this .datasource)
{
// 画X轴下标
sbText.Append( " <v:line from=' " + num * UnitLength + " , " + yheight + " ' to=' " + num * UnitLength + " , " + (yheight + bgdistance) + " '> "
+ " </v:line><v:shape style='left: " + (num * UnitLength - 50 ) + " ;top: " + yheight + " ;'><v:textbox> " + var.Key + " </v:textbox></v:shape> " );
height = var.value;
Zhuposition = ((num - 1 ) * UnitLength + UnitLength / 2 ) - (zhuWidth / 2 );
if (ColorIndex >= ZColor.Length / 2 )
{
ColorIndex = 0 ;
}
// sbText.Append("<v:rect id='DataZhu"+num+"' style='z-index:1; position:absolute; top:" + (yheight - height) + ";"
sbText.Append( " <v:rect id='DataZhu " + num + " ' style='z-index:1; position:absolute; top: " + yheight + " ; "
+ " left: " + Zhuposition + " ;width: " + zhuWidth + " ;height:0;' fillcolor=' " + ZColor[ColorIndex, 0 ] + " '> "
+ " <v:fill color2=' " + ZColor[ColorIndex, 1 ] + " ' rotate='t' type='gradient'/> "
+ " <v:extrusion v:ext='view' backdepth=' " + ( 2 * bgdistance) + " ' color=' " + ZColor[ColorIndex, 0 ] + " ' brightness='0.2' on='t'/></v:rect> "
+ " <v:TextBox id='ShowData " + num + " ' style='position:absolute;display:none;z-index:2;top: " + (yheight - 20 ) + " ; left: " + Zhuposition + " '> " + height + " </v:TextBox> " );
strHeight += height + " , " ;
strTop += (yheight - height) + " , " ;
ColorIndex ++ ;
num ++ ;
}
return 1 ;
}
//
private void ComputeY( int YHeight)
{
YHeight -= 10 ; // 箭头下面的长度
if (yItemWidth > 0 )
{
int Units = YHeight / yItemWidth; // 计算单位长度
for ( int i = 0 ; i <= Units; i ++ )
{
int areaLenght = yheight - (i * yItemWidth);
sbText.Append( " <v:line from='0, " + areaLenght + " ' to=' " + bgdistance + " , " + (areaLenght - bgdistance) + " ' color=' " + lineColor + " '><v:stroke color=' " + lineColor + " '/></v:line> "
+ " <v:line from='0, " + areaLenght + " ' to='-10, " + areaLenght + " '> "
+ " </v:line><v:shape style='top: " + (areaLenght - 10 ) + " ;left:-50;'><v:TextBox> " + i * yItemWidth + " </v:TextBox></v:shape> "
+ " <v:line from=' " + bgdistance + " , " + (areaLenght - bgdistance) + " ' to=' " + xwidth + " , " + (areaLenght - bgdistance) + " '><v:stroke color=' " + lineColor + " '/></v:line> " );
}
// 画Y轴平行的线
sbText.Append( " <v:line id='YzhouPX' from=' " + bgdistance + " , " + (yheight - bgdistance) + " ' to=' " + bgdistance + " , " + ((yheight - (Units * yItemWidth)) - bgdistance) + " '><v:stroke color=' " + lineColor + " '/></v:line> " );
}
}
#endregion
#region 画饼图
private void DrawBingImage()
{
base .Text = "" ;
// 定义颜色
string [] Colors = new string [ 6 ];
Colors[ 0 ] = " #666699 " ;
Colors[ 1 ] = " #00ff00 " ;
Colors[ 2 ] = " #ff0000 " ;
Colors[ 3 ] = " #ff9900 " ;
Colors[ 4 ] = " #33cccc " ;
Colors[ 5 ] = " #993300 " ;
// 开始标记
// sbText.Append("<div id='pic' style='position:absolute;'>");
//
double TotalCount = 0 ;
foreach (VmlDataSource vd in datasource)
{
TotalCount += vd.value;
}
// 计算单位数字的角度
double UnitAngle = 360 / TotalCount;
// 存储画下弧度的起点
double TempUnitArc = 0.00 ;
// 存储前面已有的角度
double TempUnitAngle = 0.00 ;
int i = 0 ;
string ColorInfo = "" ;
sbText.Append( " <div id='PicDiv' style='left:0;position:relative; top:0; width: " + xwidth + " ; height: " + yheight + " ;text-align:left; font-size:12px; border:solid 1px red;'> " );
sbText.Append( " <div style='left: " + (radii + xposition) + " ;position:relative; top: " + (radii + yposition) + " ;'> " );
sbText.Append( " <v:TextBox id='msgShow' inset='5pt,5pt,5pt,5pt' style='width: " + Colors[i] + " ;position:absolute;z-index:2;display:none;background-color:red; font-size:12px;'></v:TextBox> " );
foreach (VmlDataSource vd in datasource)
{
// 计算弧度
double UnitArc = (vd.value * UnitAngle + TempUnitAngle) * Math.PI / 180 ;
// 计算开始和结束位置
double sx = Math.Round(Math.Cos(TempUnitArc) * radii); // Math.Sign(
double sy = Math.Round(Math.Sin(TempUnitArc) * radii);
double ex = Math.Round(Math.Cos(UnitArc) * radii);
// double aa = Math.Sin(UnitArc) * radii;
// double bb = Math.Round(Math.Sin(UnitArc) * radii,4);
double ey = Math.Round(Math.Sin(UnitArc) * radii);
// 所占百份比
double rate = Math.Round(vd.value * 100 / TotalCount, 2 );
// 开始画图
sbText.Append( " <v:shape ID='ccc' style='position:absolute;width:200px; height:200px;'coordsize='200,200' fillcolor='# " + Colors[i] + " ' filled='t' strokecolor='#FFFFFF' " );
sbText.Append( " path='m0,0 l " + sx + " , " + sy + " ar- " + radii + " ,- " + radii + " , " + radii + " , " + radii + " , " + ex + " , " + ey + " , " + sx + " , " + sy + " l0,0 x e' " );
sbText.Append( " title='名称: " + vd.key + " \r数量: " + vd.value + " \r所占比例: " + rate + " %'></v:shape> " );
// 给临时变量赋值
TempUnitAngle += vd.value * UnitAngle;
TempUnitArc = UnitArc;
// 显示颜色说明框
ColorInfo += " <div style='position:relative;padding-top:3px;padding-bottom:3px;' title='所占比例: " + rate + " %' onMouseOver='this.style.border=\ " solid 1px #D38F61\ " ' onMouseOut='this.style.border=\ " none\ " '> "
+ " <v:rect style='position:relative;width:20px;height:20px;' fillcolor=' " + Colors[i] + " '/> " + vd.key + " : " + vd.value + " ( " + rate + " %)</div> "
;
// 如果颜色遍历完了,还有数据要显示那就重新再一次遍历。占:" + (Math.Round(vd.value * 100 / TotalCount, 2)) + "%
i = (i >= Colors.Length ? 0 : ++ i);
}
sbText.Append( " </div> " );
sbText.Append( " <div style='border:solid 1px #000;padding:10px;margin-right:10px;position:relative;left: " + ( 2 * radii + 20 + xposition) + " px;top:10px;width: " + (xwidth - ( 2 * radii + 40 + xposition)) + " ;'> " );
// sbText.Append("<div style='padding-left:10px;width:" + (xwidth - (2 * radii +30+ xposition)) +";height:auto;'>");
// 总数
sbText.Append( " <div style='background-color:#000;color:#fff;'>总数据: " + TotalCount + " </div> " );
sbText.Append(ColorInfo);
sbText.Append( " </div></div> " );
this .Text = sbText.ToString();
}
#endregion
/// <summary>
/// 控件加载时画图
/// </summary>
/// <param name="e"></param>
protected override void OnLoad(EventArgs e)
{
base .OnLoad(e); // Page.RegisterStartupScript("HelloWord", "<script>alert('BBB');</script>");
DrawVml();
// Page.RegisterStartupScript("", "<script>alert('aaa');</script>");
}
protected override void OnPreRender(EventArgs e)
{
base .OnPreRender(e);
Page.RegisterStartupScript( "" , " <script>AllPlay();</script> " );
}
}
* 注意里面的数据源类型和枚举在下面定义.
/// <summary>
/// 画图时用的数据源
/// </summary>
public class VmlDataSource
{
public VmlDataSource()
{
}
public string key;
public double value;
/// <summary>
/// 键值
/// </summary>
public string Key
{
get { return key; }
set { key = value; }
}
public double Value
{
get
{
if ( this .value.GetType() != Type.GetType( " System.Int32 " ))
return 0 ;
else
return this .value;
}
set
{
this .value = value;
}
}
}
/// <summary>
/// 枚举画图的类型
/// </summary>
public enum IszhuOrBing
{
//
Zhu = 0 ,
//
Bing = 1
}
}
整个过程就是这样了,不过这只是个粗略的过程里面还很多的BUG没有解觉掉.画数据统计的图表完成了.
private int yposition;
private int xwidth;
private int yheight;
private bool isdrawVML;
private int bgdistance; // 背景距离(斜线之间的垂直距离)
private int zhuWidth;
private string lineColor;
private int yItemWidth;
private string xSign; // X轴标记
private string ySign; // Y轴标记
private List < VmlDataSource > datasource;
private IszhuOrBing isZhuOrBing;
private int radii; // 画饼图要用的半径
public IszhuOrBing IsZhuOrBing
{
get { return isZhuOrBing; }
set { isZhuOrBing = value; }
}
#region 属性的定义
/// <summary>
/// 画饼图的半径
/// </summary>
public int Redii
{
get { return radii; }
set { radii = value; }
}
/// <summary>
/// X轴的位置
/// </summary>
public int XPosition
{
get { return xposition; }
set { xposition = value; }
}
/// <summary>
/// Y轴位置
/// </summary>
public int YPosition
{
get { return yposition; }
set { yposition = value; }
}
//
/// <summary>
/// X轴宽度
/// </summary>
public int XWidth
{
get { return xwidth; }
set { xwidth = value; }
}
//
/// <summary>
/// Y轴高度
/// </summary>
public int YHeight
{
get { return yheight; }
set { yheight = value; }
}
/// <summary>
/// 是否是画VML图
/// </summary>
public bool IsDrawVML
{
get { return isdrawVML; }
set { isdrawVML = value; }
}
/// <summary>
/// 背景距离(斜线之间的垂直距离)
/// </summary>
public int BgDistance
{
get
{
return bgdistance;
}
set
{
if (value <= 0 )
bgdistance = 10 ;
else
bgdistance = value;
}
}
/// <summary>
/// 柱子的宽度
/// </summary>
public int ZhuWidth
{
get { return zhuWidth; }
set { zhuWidth = value; }
}
/// <summary>
/// 柱子的颜色
/// </summary>
public string LineColor
{
get { return lineColor; }
set { lineColor = value; }
}
/// <summary>
/// Y轴方向的间距
/// </summary>
public int YItemWidth
{
get { return yItemWidth; }
set { yItemWidth = value; }
}
/// <summary>
/// X轴标识
/// </summary>
public string XSign
{
get { return xSign; }
set { xSign = value; }
}
/// <summary>
/// Y轴标识
/// </summary>
public string YSign
{
get { return ySign; }
set { ySign = value; }
}
/// <summary>
/// 数据源(柱子高度)
/// </summary>
public List < VmlDataSource > DataSource
{
get { return datasource; }
set { datasource = value; }
}
#endregion
判断是画柱图还是饼图.
// 画VML图
StringBuilder sbText = new StringBuilder();
string strHeight = "" ;
string strTop = "" ;
public void DrawVml()
{
if (isdrawVML == true )
{ //
if (isZhuOrBing == IszhuOrBing.Bing)
{
DrawBingImage();
}
else if (isZhuOrBing == IszhuOrBing.Zhu)
{
DrawZhuImage();
}
}
}
*** IsZhuOrBing是一个自定义的枚举类型.
// 柱子一升的脚本
private string RegisterScript()
{
string m_strScript = " <script language='javascript' type='text/javascript'> "
+ " var gao=0; "
+ " var ProcID=0; "
+ " var ProcName=null; "
+ " var i=0; "
+ " var HeightContent=document.getElementById('heightDataSource').value; "
+ " var arrHeight=new Array(); "
+ " var arrTop=new Array(); "
+ " arrHeight=HeightContent.split(','); "
+ " var showBar=null; "
+ " function AllPlay() "
+ " { "
+ " i++; "
+ " gao=0; "
+ " var procBarID='DataZhu'+i; " // ;
+ " Play(procBarID); "
+ " } "
+ " function Play(procBarID) "
+ " { "
+ " var procBar=document.getElementById(procBarID); "
+ " if(procBar!=null) "
+ " { "
+ " ProcName=procBar; "
+ " PlaySub(); "
+ " } "
+ " } "
+ " function PlaySub() "
+ " { "
+ " var procBar=ProcName; "
+ " showBar=document.getElementById('ShowData'+i); "
+ " showBar.style.display='block'; "
+ " gao++; "
+ " var ygao=parseInt(procBar.style.height); "
+ " var ytop=parseInt(procBar.style.top); "
+ " if(ygao<arrHeight[i-1]) "
+ " { "
+ " procBar.style.top=ytop-gao; "
+ " procBar.style.height=ygao+gao; "
+ " showBar.style.top=ytop-gao-25; "
+ " setTimeout(PlaySub,20); "
+ " } "
+ " else "
+ " { "
+ " AllPlay(); "
+ " } "
+ " } "
+ " </script> " ;
return m_strScript;
}
上面的那段代码是要向客户端注册的JS脚本用于,画柱图时渐长效果的.
开始画VML图
// 画柱图.
public void DrawZhuImage()
{
base .Text = "" ;
// 画Div
// sbText.Append("<div style=' border:solid 1px red;width:" + (xwidth+10) + "; height:" + (yheight+10) + ";;filter : progid:DXImageTransform.Microsoft.DropShadow ( enabled=true , color=#66333333 , offX=4 , offY=4 , positive=true );'>");
sbText.Append( " <div id='PicDiv' style='left:0;position:relative; top:0; width: " + xwidth + " ; height: " + yheight + " ;text-align:left;'> " );
// base.Style.Value = "left:" + xposition + ";position:relative; top:" + yposition + "; width:" + (xwidth+20) + "; height:" + (20+yheight) + ";'";
// 画X轴
sbText.Append( " <v:line id='Xzhou' from='0, " + yheight + " ' to=' " + xwidth + " , " + yheight + " '> "
+ " <v:stroke EndArrow='Classic'/></v:line><v:TextBox style='position:absolute; width:100px;top: " + (yheight + 10 ) + " ;left: " + (xwidth) + " '> " + xSign + " </v:TextBox> " );
// 画X轴方向的线条
int HaveData = ComputeX(xwidth);
// if (HaveData == 0)
// {
// sbText.Append("</div>");
// base.Text = sbText.ToString(0, sbText.Length);
// return;
// }
// 画Y轴
sbText.Append( " <v:line id='Yzhou' from='0, " + yheight + " ' to='0,0'><v:stroke EndArrow='Classic'/><v:TextBox style=' width:100px;padding-left:10px;'> " + ySign + " </v:TextBox></v:line> " );
// 画Y轴方向的线条
ComputeY(yheight);
// 画DIV结束标记
sbText.Append( " </div> " );
// 画隐形文本框
sbText.Append( " <input type='hidden' value=' " + strHeight.Substring( 0 , strHeight.Length - 1 ) + " ' name='heightDataSource' id='heightDataSource'/> " );
sbText.Append( " <input type='hidden' value=' " + strTop.Substring( 0 , strTop.Length - 1 ) + " ' name='topDataSource' id='topDataSource'/> " );
// 给Lable控件的Text赋值
base .Text = sbText.ToString( 0 , sbText.Length);
Page.RegisterStartupScript( " zhuup " , RegisterScript());
}
//
private int ComputeX( int XWidth)
{ // 柱子颜色数组
string [,] ZColor = new string [ 6 , 2 ];
ZColor[ 0 , 0 ] = " #666699 " ; ZColor[ 0 , 1 ] = " #d9d9e5 " ;
ZColor[ 1 , 0 ] = " #00ff00 " ; ZColor[ 1 , 1 ] = " #d1ffd1 " ;
ZColor[ 2 , 0 ] = " #ff0000 " ; ZColor[ 2 , 1 ] = " #ffbbbb " ;
ZColor[ 3 , 0 ] = " #ff9900 " ; ZColor[ 3 , 1 ] = " #ffe3bb " ;
ZColor[ 4 , 0 ] = " #33cccc " ; ZColor[ 4 , 1 ] = " #cff4f3 " ;
ZColor[ 5 , 0 ] = " #993300 " ; ZColor[ 5 , 1 ] = " #ffc7ab " ;
XWidth -= 10 ; // 箭头下面的长度
int ColorIndex = 0 ;
double height = 0 ;
int Zhuposition = 0 ;
int Count = this .DataSource == null ? XWidth: this .DataSource.Count;
int num = 1 ;
// Count = 0;
// if (Count == 0)
// {
// sbText.Append("<div style='font-size:14px;color:red;'>暂无数据</div>");
// return 0;
// }
int UnitLength = XWidth / Count; // 计算单位长度
foreach (VmlDataSource var in this .datasource)
{
// 画X轴下标
sbText.Append( " <v:line from=' " + num * UnitLength + " , " + yheight + " ' to=' " + num * UnitLength + " , " + (yheight + bgdistance) + " '> "
+ " </v:line><v:shape style='left: " + (num * UnitLength - 50 ) + " ;top: " + yheight + " ;'><v:textbox> " + var.Key + " </v:textbox></v:shape> " );
height = var.value;
Zhuposition = ((num - 1 ) * UnitLength + UnitLength / 2 ) - (zhuWidth / 2 );
if (ColorIndex >= ZColor.Length / 2 )
{
ColorIndex = 0 ;
}
// sbText.Append("<v:rect id='DataZhu"+num+"' style='z-index:1; position:absolute; top:" + (yheight - height) + ";"
sbText.Append( " <v:rect id='DataZhu " + num + " ' style='z-index:1; position:absolute; top: " + yheight + " ; "
+ " left: " + Zhuposition + " ;width: " + zhuWidth + " ;height:0;' fillcolor=' " + ZColor[ColorIndex, 0 ] + " '> "
+ " <v:fill color2=' " + ZColor[ColorIndex, 1 ] + " ' rotate='t' type='gradient'/> "
+ " <v:extrusion v:ext='view' backdepth=' " + ( 2 * bgdistance) + " ' color=' " + ZColor[ColorIndex, 0 ] + " ' brightness='0.2' on='t'/></v:rect> "
+ " <v:TextBox id='ShowData " + num + " ' style='position:absolute;display:none;z-index:2;top: " + (yheight - 20 ) + " ; left: " + Zhuposition + " '> " + height + " </v:TextBox> " );
strHeight += height + " , " ;
strTop += (yheight - height) + " , " ;
ColorIndex ++ ;
num ++ ;
}
return 1 ;
}
//
private void ComputeY( int YHeight)
{
YHeight -= 10 ; // 箭头下面的长度
if (yItemWidth > 0 )
{
int Units = YHeight / yItemWidth; // 计算单位长度
for ( int i = 0 ; i <= Units; i ++ )
{
int areaLenght = yheight - (i * yItemWidth);
sbText.Append( " <v:line from='0, " + areaLenght + " ' to=' " + bgdistance + " , " + (areaLenght - bgdistance) + " ' color=' " + lineColor + " '><v:stroke color=' " + lineColor + " '/></v:line> "
+ " <v:line from='0, " + areaLenght + " ' to='-10, " + areaLenght + " '> "
+ " </v:line><v:shape style='top: " + (areaLenght - 10 ) + " ;left:-50;'><v:TextBox> " + i * yItemWidth + " </v:TextBox></v:shape> "
+ " <v:line from=' " + bgdistance + " , " + (areaLenght - bgdistance) + " ' to=' " + xwidth + " , " + (areaLenght - bgdistance) + " '><v:stroke color=' " + lineColor + " '/></v:line> " );
}
// 画Y轴平行的线
sbText.Append( " <v:line id='YzhouPX' from=' " + bgdistance + " , " + (yheight - bgdistance) + " ' to=' " + bgdistance + " , " + ((yheight - (Units * yItemWidth)) - bgdistance) + " '><v:stroke color=' " + lineColor + " '/></v:line> " );
}
}
#endregion
#region 画饼图
private void DrawBingImage()
{
base .Text = "" ;
// 定义颜色
string [] Colors = new string [ 6 ];
Colors[ 0 ] = " #666699 " ;
Colors[ 1 ] = " #00ff00 " ;
Colors[ 2 ] = " #ff0000 " ;
Colors[ 3 ] = " #ff9900 " ;
Colors[ 4 ] = " #33cccc " ;
Colors[ 5 ] = " #993300 " ;
// 开始标记
// sbText.Append("<div id='pic' style='position:absolute;'>");
//
double TotalCount = 0 ;
foreach (VmlDataSource vd in datasource)
{
TotalCount += vd.value;
}
// 计算单位数字的角度
double UnitAngle = 360 / TotalCount;
// 存储画下弧度的起点
double TempUnitArc = 0.00 ;
// 存储前面已有的角度
double TempUnitAngle = 0.00 ;
int i = 0 ;
string ColorInfo = "" ;
sbText.Append( " <div id='PicDiv' style='left:0;position:relative; top:0; width: " + xwidth + " ; height: " + yheight + " ;text-align:left; font-size:12px; border:solid 1px red;'> " );
sbText.Append( " <div style='left: " + (radii + xposition) + " ;position:relative; top: " + (radii + yposition) + " ;'> " );
sbText.Append( " <v:TextBox id='msgShow' inset='5pt,5pt,5pt,5pt' style='width: " + Colors[i] + " ;position:absolute;z-index:2;display:none;background-color:red; font-size:12px;'></v:TextBox> " );
foreach (VmlDataSource vd in datasource)
{
// 计算弧度
double UnitArc = (vd.value * UnitAngle + TempUnitAngle) * Math.PI / 180 ;
// 计算开始和结束位置
double sx = Math.Round(Math.Cos(TempUnitArc) * radii); // Math.Sign(
double sy = Math.Round(Math.Sin(TempUnitArc) * radii);
double ex = Math.Round(Math.Cos(UnitArc) * radii);
// double aa = Math.Sin(UnitArc) * radii;
// double bb = Math.Round(Math.Sin(UnitArc) * radii,4);
double ey = Math.Round(Math.Sin(UnitArc) * radii);
// 所占百份比
double rate = Math.Round(vd.value * 100 / TotalCount, 2 );
// 开始画图
sbText.Append( " <v:shape ID='ccc' style='position:absolute;width:200px; height:200px;'coordsize='200,200' fillcolor='# " + Colors[i] + " ' filled='t' strokecolor='#FFFFFF' " );
sbText.Append( " path='m0,0 l " + sx + " , " + sy + " ar- " + radii + " ,- " + radii + " , " + radii + " , " + radii + " , " + ex + " , " + ey + " , " + sx + " , " + sy + " l0,0 x e' " );
sbText.Append( " title='名称: " + vd.key + " \r数量: " + vd.value + " \r所占比例: " + rate + " %'></v:shape> " );
// 给临时变量赋值
TempUnitAngle += vd.value * UnitAngle;
TempUnitArc = UnitArc;
// 显示颜色说明框
ColorInfo += " <div style='position:relative;padding-top:3px;padding-bottom:3px;' title='所占比例: " + rate + " %' onMouseOver='this.style.border=\ " solid 1px #D38F61\ " ' onMouseOut='this.style.border=\ " none\ " '> "
+ " <v:rect style='position:relative;width:20px;height:20px;' fillcolor=' " + Colors[i] + " '/> " + vd.key + " : " + vd.value + " ( " + rate + " %)</div> "
;
// 如果颜色遍历完了,还有数据要显示那就重新再一次遍历。占:" + (Math.Round(vd.value * 100 / TotalCount, 2)) + "%
i = (i >= Colors.Length ? 0 : ++ i);
}
sbText.Append( " </div> " );
sbText.Append( " <div style='border:solid 1px #000;padding:10px;margin-right:10px;position:relative;left: " + ( 2 * radii + 20 + xposition) + " px;top:10px;width: " + (xwidth - ( 2 * radii + 40 + xposition)) + " ;'> " );
// sbText.Append("<div style='padding-left:10px;width:" + (xwidth - (2 * radii +30+ xposition)) +";height:auto;'>");
// 总数
sbText.Append( " <div style='background-color:#000;color:#fff;'>总数据: " + TotalCount + " </div> " );
sbText.Append(ColorInfo);
sbText.Append( " </div></div> " );
this .Text = sbText.ToString();
}
#endregion
/// <summary>
/// 控件加载时画图
/// </summary>
/// <param name="e"></param>
protected override void OnLoad(EventArgs e)
{
base .OnLoad(e); // Page.RegisterStartupScript("HelloWord", "<script>alert('BBB');</script>");
DrawVml();
// Page.RegisterStartupScript("", "<script>alert('aaa');</script>");
}
protected override void OnPreRender(EventArgs e)
{
base .OnPreRender(e);
Page.RegisterStartupScript( "" , " <script>AllPlay();</script> " );
}
}
* 注意里面的数据源类型和枚举在下面定义.
/// <summary>
/// 画图时用的数据源
/// </summary>
public class VmlDataSource
{
public VmlDataSource()
{
}
public string key;
public double value;
/// <summary>
/// 键值
/// </summary>
public string Key
{
get { return key; }
set { key = value; }
}
public double Value
{
get
{
if ( this .value.GetType() != Type.GetType( " System.Int32 " ))
return 0 ;
else
return this .value;
}
set
{
this .value = value;
}
}
}
/// <summary>
/// 枚举画图的类型
/// </summary>
public enum IszhuOrBing
{
//
Zhu = 0 ,
//
Bing = 1
}
}
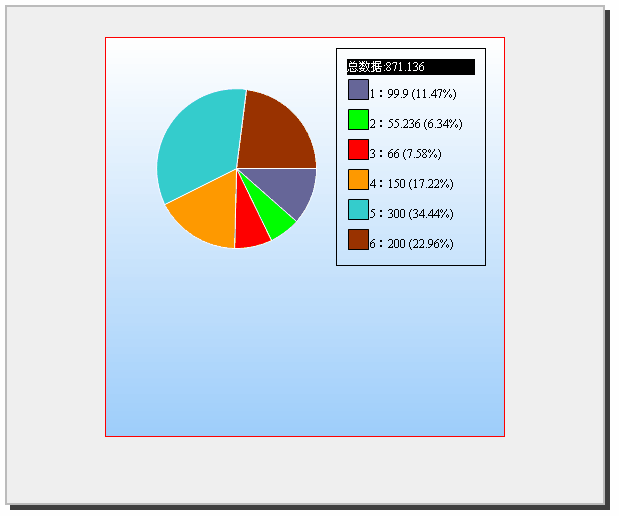
效果图如下.

饼图为:


 2273
2273

 被折叠的 条评论
为什么被折叠?
被折叠的 条评论
为什么被折叠?
 到【灌水乐园】发言


