


寻找Release版程发生异常退出的地方比Debug版麻烦得多。发生异常的时候windows通常会弹出一个错误对话框,点击详细信息,我们能获得出错的地址和大概的出错信息,然后可以用以下办法分析我们的程序。
一. 用MAP文件定位异常代码位置。
1.如何生成map文件
打开“Project →Project Settings”,选择 C/C++ 选项卡,在“Debug Info”栏选择“Line Numbers Only”(或者在最下面的 Project Options 里面输入:/Zd),然后要选择 Link 选项卡,选中“Generate mapfile”复选框,并再次编辑 Project Options,输入:/mapinfo:lines,以便在 MAP 文件中加入行信息。然后编译工程则可以在输出目录得到同名的.map文件。
2. 使用map文件定位发生异常的代码行
编译得到的map文件可以用文本方式打开,大致是这样的格式:(括号内是PomeloWu填加的注释)
0729 (←工程名)
Timestamp is 42e9bc51 (Fri Jul 29 14:19:13 2005) (←时间戳)
Preferred load address is 00400000 (←基址)
……(Data段描述,省略)
Address Publics by Value Rva+Base Lib:Object
0001:00000000 ?_GetBaseMessageMap@C0729App@@KGPBUAFX_MSGMAP@@XZ 00401000 f 0729.obj
……(↑这一行开始是函数信息,下面省略)
Line numbers for .ReleaseShowDlg.obj(C:729ShowDlg.cpp) segment .text
24 0001:00003f90 28 0001:00003fce 29 0001:00003fd1 30 0001:00003fd4
……(行号信息,前面的数字是行号,后一个数字是偏移量,下面省略)
在获得程序异常的地址以后,首先通过函数信息部分定位出错的OBJ和函数。做法是用获得的异常地址与Rva+Base栏地址进行比较(Rva,偏移地址;Base,基址)。找到最后一个比获得的异常地址小的那个函数,那就是出错的函数。
之后,用获得的异常地址减去该函数的Rva+Base,就得到了异常行代码相对于函数起始地址的偏移。在“Line number for”部分找到相对应的模块,并把其后的行号信息与上面减得的偏移量对比,找到最接近的一个,前面的行号大致就是目标行了。
二. 获得错误的详细信息。
实际上,光靠Windows的错误消息对话框提供的信息量是很有限的,用自己写的exception filter可以获得更多的错误信息。用SetUnhandledExceptionFilter设定自定义错误处理回调函数替换Win32默认的top-level exception filter:
² SetUnhandledExceptionFilter的函数原型:
LPTOP_LEVEL_EXCEPTION_FILTER SetUnhandledExceptionFilter(
LPTOP_LEVEL_EXCEPTION_FILTER lpTopLevelExceptionFilter
// exception filter function
);
² SetUnhandledExceptionFilter返回当前的exception filter。应当保存这个函数指针并在不再需要使用自定义错误处理函数的时候当作参数再次调用SetUnhandledExceptionFilter。
² lpTopLevelExceptionFilter 是自定义的exception filter函数指针,如果传入NULL值则指定UnhandledExceptionFilter来负责异常处理。lpTopLevelExceptionFilter其函数原型应该是与UnhandledExceptionFilter同型:
LONG WINAPI UnhandledExceptionFilter(
STRUCT _EXCEPTION_POINTERS *ExceptionInfo // address of
// exception info
);
² lpTopLevelExceptionFilter的返回值应该是下面3种之一:
EXCEPTION_EXECUTE_HANDLER = 1
EXCEPTION_CONTINUE_EXECUTION = -1
这两个返回值都应该由调用UnhandledExceptionFilter后返回。
EXCEPTION_EXECUTE_HANDLER表示进程结束
EXCEPTION_CONTINUE_EXECUTION表示处理异常之后继续执行
EXCEPTION_CONTINUE_SEARCH = 0
进行系统通常的异常处理(错误消息对话框)
² lpTopLevelExceptionFilter的唯一的参数是_EXCEPTION_POINTERS结构指针。
typedef struct _EXCEPTION_POINTERS { // exp
PEXCEPTION_RECORD ExceptionRecord;
PCONTEXT ContextRecord;
} EXCEPTION_POINTERS;
其中PCONTEXT是一个指向进程上下文结构的指针,保存了各个寄存器在异常发生的时候的值,详细信息参考《Windows核心编程》。
ExceptionRecord则指向另一个结构体EXCEPTION_RECORD:
typedef struct _EXCEPTION_RECORD { // exr
DWORD ExceptionCode;
DWORD ExceptionFlags;
struct _EXCEPTION_RECORD *ExceptionRecord;
PVOID ExceptionAddress;
DWORD NumberParameters;
DWORD ExceptionInformation[EXCEPTION_MAXIMUM_PARAMETERS];
} EXCEPTION_RECORD;
DWORD ExceptionCode;
异常代码,指出异常原因。常见异常代码有:
EXCEPTION_ACCESS_VIOLATION = C0000005h
读写内存冲突
EXCEPTION_INT_DIVIDE_BY_ZERO = C0000094h
除0错误
EXCEPTION_STACK_OVERFLOW = C00000FDh
堆栈溢出或者越界
EXCEPTION_GUARD_PAGE = 80000001h
由Virtual Alloc建立起来的属性页冲突
EXCEPTION_NONCONTINUABLE_EXCEPTION = C0000025h
不可持续异常,程序无法恢复执行,异常处理例程不应处理这个异常
EXCEPTION_INVALID_DISPOSITION = C0000026h
在异常处理过程中系统使用的代码
EXCEPTION_BREAKPOINT = 80000003h
调试时中断(INT 3)
EXCEPTION_SINGLE_STEP = 80000004h
单步调试状态(INT 1)
DWORD ExceptionFlags;
异常标志
0,表示可修复异常
EXCEPTION_NONCONTINUABLE = 1,表示不可修复异常。在不可修复异常后尝试继续执行会导致EXCEPTION_NONCONTINUABLE_EXCEPTION = C0000025H异常。
struct _EXCEPTION_RECORD *ExceptionRecord;
当异常处理程序中发生异常时,此字段被填充,否则为NULL
PVOID ExceptionAddress;
发生异常的地址(EIP)
DWORD NumberParameters;
规定与异常相关的参数数量(0-15),是ExceptionInformation数组中元素个数。
DWORD ExceptionInformation[EXCEPTION_MAXIMUM_PARAMETERS];
异常描述信息,大多数异常都未定义此数组,仅有EXCEPTION_ACCESS_VIOLATION异常的描述信息:
ExceptionInformation[0],描述导致异常的操作类型
= 0 读异常
= 1 写异常
ExceptionInformation[1],发生读写异常的内存地址
也就是说,只要注册了自己写的这个exception filter,一旦发生异常,进入这个exception filter,从参数我们就能获得各种需要的信息了。而这个exception filter需要做的就是保存这些信息,然后将异常处理的事情交还给系统就行了:
// in the beginning
// Install the unhandled exception filter function
g_previousFilter = SetUnhandledExceptionFilter(MyUnhandledExceptionFilter);
// exception filter
LONG WINAPI MyUnhandledExceptionFilter(PEXCEPTION_POINTERS pExceptionInfo)
{
WriteLogFile(pExceptionInfo); // 写入文件
if ( g_previousFilter )
return g_previousFilter( pExceptionInfo );
else
return EXCEPTION_CONTINUE_SEARCH;
}
三. 使用COD文件精确分析异常原因
说精确分析多少有点言过其实,发生异常的情况各不相同,分析真正原因很可能是一件极其复杂的事情。不过用COD文件能比MAP文件更精确地定位产生异常的位置。结合汇编代码和自定义的exception filter获得的错误情报寄存器状态等各种信息,找到异常发生的直接原因是很容易的。
1. 如何生成cod文件
仍然是打开“Project →Project Settings”,选择 C/C++ 选项卡,在“Category”栏选择“Listing Files”然后在Listing file type栏选择“Assembly with Machine Code”。重新编译工程后则可以在输出目录看到与每一个.cpp文件同名的.cod文件。
2. Cod文件的使用
首先还是利用map文件用获得的程序异常地址通过函数信息部分定位出错的OBJ和函数,并同样记录偏移地址(用获得的异常地址减去该函数的Rva+Base的差值)。然后,在相应的cod文件中(而不是在map文件后面的行号信息部分)来查找出错的函数,找到如下的格式:
?OnPaint@CShowDlg @@IAEXXZ PROC NEAR ; CShowDlg::OnPaint, COMDAT
; 81 : { (←格式为:行号 : 源代码)
00000 83 ec 64 sub esp, 100 ; 00000064H
(↑偏移地址) (↖机器码) (↑汇编码)
00003 56 push esi
; 82 : if (IsIconic())
(下面省略)
找到出错的函数以后,再用偏移地址就能找到准确的异常发生的地方。然后通过源程序、汇编码即可进行更详尽的分析了。
http://www.codeproject.com/KB/debug/postmortemdebug_standalone1.aspx
Summary: If your application crashes at a customer site, you can now debug it after the fact using minidumps and the Microsoft� Visual Studio� NET debugger. This article describes how minidumps work, how to make your application create them when it crashes, and how to read them back with Visual Studio .NET. Minidumps are key to the Microsoft error reporting program to improve the reliability of the Windows operating system and applications such as Visual Studio .NET. This article also describes how to use the Microsoft symbol server to automatically find symbols for system components. This article assumes that you are familiar with Win32 and C++ programming.
Contents
What Is a Minidump?
Creating a Minidump
Build Issues
Writing a Minidump with MiniDumpWriteDump
Reading a Minidump with Visual Studio .NET
How Microsoft Uses Minidumps
Further Improvements
Conclusion
What Is a Minidump?
A minidump is a file containing the most important parts of a crashed application. It is written on the user�s machine and then the customer can submit it to the developer. The developer can load the dump to help determine the cause of the crash and develop a fix.
Since the early days of Windows NT, the Dr. Watson program has been able to generate crash dump files, denoted with the .dmp extension. However, they were not as useful as they should have been because of two problems:
- They were huge. The dump of an application included every byte of the entire process space, so a crash in something simple like Notepad would be several megabytes in size, and a crash in something like Word can be many hundreds of megabytes. The files were just too big to send by e-mail or FTP.
- Their content was not necessarily useful. Dr. Watson was, in fact, a just-in-time (JIT) debugger, and it is difficult for a debugger to get the full path to a loaded module. Full debuggers such as the Visual Studio debugger complete a number of steps to get the paths, but Dr. Watson did not. This usually resulted in unhelpful module names such as MOD0000 and so on.
Minidumps were designed to fix these problems in a number of ways:
- Instead of saving the entire process space, only certain sections are saved. There is no point in saving copies of modules such as Kernel32.dll; if the version number is included, it is easy to get a copy from a Windows CD. The actual memory heap of the application is by default not saved in a minidump; it is not required to debug a surprisingly high percentage of crashes. You can save the heap if you need to, however.
- The minidump save code works to get accurate and full information for modules, including their names, paths, version information, and internal timestamps.
- The minidump save code also gets the list of threads, their contexts (that is, register sets), and the memory behind their stacks.
- The whole file is compressed, further reducing its size. A minidump for Notepad is around 6K on Windows XP, almost 300 times smaller than the previous crash dump of the same process.
Note Kernel-mode minidumps, which are generated by Windows XP after a computer stops responding, also exist, but this article discusses more common user-mode minidumps.
Creating a Minidump
There are three ways to create a minidump:
- Add code to your own application to write a minidump if the application has an unhandled exception.
- In the integrated development environment of Visual Studio .NET, click Save Dump on the Debug menu when debugging the application.
- Do nothing.
The first option is discussed in more detail in the following sections.
The second option works only on a workstation with the debugger already configured, which is likely useful only within an organization (for example, with another developer or tester). If you debug a crash with Visual Studio .NET, you can then click Save Dump As on the Debug menu. You can save as a Minidump or Minidump With Heap. You do not need any symbols or PDBs configured to save a dump file; you will need them later, however, to read it back.
The third option works only in Windows XP, which automatically creates a minidump if an application has an unhandled exception and no JIT debugger has been set up. Also, the minidump is submitted directly to Microsoft, so you will not have the opportunity to determine why.
Build Issues
To configure your application to create dumps when it stops responding, you must configure your builds to generate full debugging information, especially for retail builds. After generating a PDB, you also must archive every binary that ships to customers and its matching PDB; you will need the PDB later to debug any minidumps that your customers submit.
Also, ensure that you set the version information correctly on your binaries. Every release of every component that you ship should have a different version, so you can match them to the minidump. The version field assists you in matching the bits. The debugger itself does not use the version information, however; it matches binaries based on the internal timestamp in the PE header.
In terms of output, generating debug information for release builds has a small effect. A PDB, taking up some space on a build machine, is generated, and the binary will be a few hundred bytes larger, to record the name of the PDB in the debug directory within the PE file. You should not provide customers with the PDB; this could allow customers to more easily reverse-engineer your application.
Writing a Minidump with MiniDumpWriteDump
The key API to saving a minidump is MiniDumpWriteDump, which is exported from Dbghelp.dll, a redistributable DLL that comes with the Platform SDK. Make sure that you are using the Windows XP version 5.1.2600; earlier beta and release candidate versions had problems with the API, and versions 5.0.x are from Windows 2000 and do not export the function. If you have a version earlier than 5.0, then it comes from the Systems Debugger package (including WinDbg and so on) and is not redistributable.
To call the API, you need to catch the crash by setting an unhandled exception handler with the SetUnhandledExceptionFilter API. This allows the filter function to be called at almost any time an unhandled exception occurs in an application. In certain unhandled exceptions, such as a double stack fault, the operating system will immediately terminate the application without calling the filter or a JIT debugger.
In your filter function, you must load Dbghelp.dll. This is not as simple as calling LoadLibrary; as with Windows 2000, you will access the one from the System32 directory, which does not have the right export. The sample code in the attached file tries to load from the same location as the EXE. Install the correct version of Dbghelp.dll into the same directory as the EXE; if this does not work, then the code reverts to a plain LoadLibrary, which will only work if the application is running on Windows XP.
After loading the DLL, it then checks for the named export; if correct, it then creates a file with an appropriate name, such as saving to the Temp directory and using the application name with the .dmp extension. This handle is then passed to the API itself, with some additional information such as the process ID and the type of dump file. The sample usesMiniDumpNormal. You may want to or-in the flag value of MiniDumpWithDataSegs, which is the equivalent to the Minidump With Heap option in the Visual Studio debugger. This does result in substantially larger dump files.
Once the .dmp file is created, the application informs the user where it is stored. The user can then e-mail it or use FTP to get you the file to investigate.
To use the sample code provided, add the mdump.h file and declare one MiniDumper object at global scope. Its constructor takes an argument, which should be the basename of the minidump file. Add mdump.cpp to your project. You need to have the correct Dbghelp.dll file in the same directory as the EXE to run successfully.
You cannot debug the code that writes the minidump with a debugger (in the sample code, Minidumper::TopLevelFilter). If a debugger is attached to a process, then the unhandled exception filter will never be called. If you encounter problems, you will need to use MessageBox debugging.
Reading a Minidump with Visual Studio .NET
This section uses an example of a manually created minidump from Notepad in Windows 2000 and debugging in Windows XP.
Start Visual Studio .NET and, on the File menu, click Open Solution. Change the Files of type drop-down menu to Dump Files (*.dmp; *.mdmp), navigate to the minidump, and create a default project by clicking Open.
To launch the dump with the debugger, press F5. This will provide you with information to get started. The debugger creates a fake process; in the Output window, various module load messages are displayed. The debugger is recreated the crashed processes state only. After displaying a warning that the EXE contains no debug information, the debugger stops with the user's crash, such as an access violation. If you then examine the Call Stack window, you will notice the lack of symbols and a lack of useful information.
Figure 1. Initial Stack with No Symbols

To read a minidump, you typically need copies of the binaries involved. To find the right binaries, open the Modules window.
Figure 2. Initial Modules with No Binaries
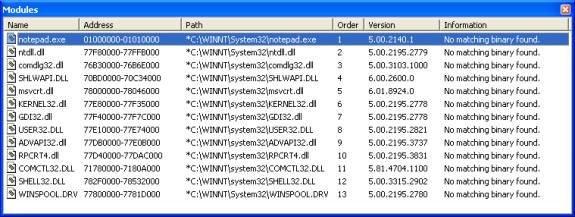
Figure 2 shows the Notepad example and demonstrates two things. First, the paths to the binaries are marked with asterisks, which denotes the path on the user's workstation but the binary could not be found at that location on your machine. Second, the messages read �No matching binary found� in the Information field. The key to finding matching binaries is to look at the Version field and the file name. In this example, the version of most system files is 2195, which indicates Windows 2000. It does not immediately indicate the exact service pack (SP) or quality fix engineering (QFE), however. For more information, see the DLL Help database at http://support.microsoft.com/servicedesks/fileversion/dllinfo.asp.
At this point, you will need to find a Windows operating system CD or a user's workstation with the correct versions and copy the correct versions into a directory. It is not normally necessary to find every binary that was in the process, but it is important to find each binary that features on every relevant call stack. This will often involve both operating system binaries (such as Kernel32.dll) and your application binaries (in this example, Notepad.exe).
When you have found the bits and copied them to a local directory, on the Debug menu, click Stop Debugging. In Solution Explorer, right-click the project icon and click Properties on the shortcut menu. This will take you to the Debugging page. Fill in the Command Arguments to be MODPATH, followed by an equal sign, and followed by a semicolon-delimited list of places to look for binaries. In this example, it is:
MODPATH=m:/sysbits
After setting the path, press F5 to reload the minidump. MODPATH reuses the command argument to get the value to the debugger; a future version of Visual Studio .NET may have a better way of setting this, perhaps as an option in the Properties dialog box.
Although finding the binaries is unlikely to improve the call stack, it should resolve some issues in the Modules window, as shown in Figure 3.
Figure 3. Modules with Binaries
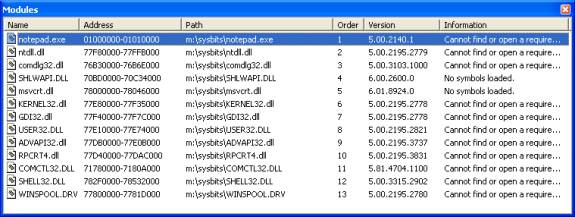
Instead of saying �No matching binary found�, it now says a combination of �Cannot find or open a required DBG file� or �No symbols loaded�. The first message occurs with system DLLs that use DBGs for their debugging information. The second message occurs for DLLs that use PDBs. Getting matching binaries will not necessarily improve your call stack; you also need debug information that matches them.
Method A: Symbols the Hard Way
To completely analyze a minidump, you should find debug information for everything, but to save time, you can find only the information you need. The example stack lists User32.dll and Kernel32.dll, so they need matching debug information.
Matching Debug Information
| Operating system | Files required |
| Windows NT 4 | DBGs |
| Windows 2000 | DBGs, PDBs |
| Windows XP | PDBs |
The best place to locate system symbols is at http://www.microsoft.com/ddk/debugging. You can also locate system symbols on the Support compact disc that ships with Windows NT Server and Windows 2000 Server operating systems. In this example, they were copied to the location of the binaries. In real instances, you will have non-Microsoft binaries listed, so you will need to have PDBs for them. Also in this example, the DBG and PDB for Notepad were also copied, because it was the sample application used.
After you click Stop Debugging on the Debug menu, pressing F5 will list a call stack, as shown in Figure 4. You may find that, as you add new binaries and debug information, your call stack will change. This is to be expected; a call stack can only be walked accurately with debug information, so as you add more information, your stack will get more accurate, which will often expose additional frames that were not in the original.
In this example, there was no crash. In real instances, you would have sufficient information to determine the cause of around 70 percent of your user crashes. In addition, this stack was created with the stripped symbols that Microsoft ships for system component, so there was no line number information. For your own binaries with full PDBs, you will get an even richer stack.
Figure 4. Call Stack with Symbols and Binaries

Symbol Servers
If you are dealing with many minidumps and performing general debugging, storing and accessing all the binary and PDB/DBG files can be difficult. Windows NT developed a technology known as a symbol server, which was originally conceived as storage for symbols but was extended to support finding binary files. The Windows NT debugger was the first tool to support this, but Visual Studio .NET also does so as an undocumented feature. For more information on symbol server, see http://www.microsoft.com/ddk/debugging/symbols.asp.
You can also retrieve symbols from the Microsoft symbol server. These symbols will be cached and indexed locally for you.
Method B: Symbols The Easy Way: Using Symbol Server
First, go to http://www.microsoft.com/ddk/debugging and download the debugging tools. You need Symsrv.dll, which needs to be on the path. You can either copy it next to devenv.exe or into your System32 directory, to allow Visual Studio .NET access to it. Once you have copied Symsrv.dll, you can safely uninstall the debugging tools. You will also need to make a local directory. For this example, create a local directory as C:/localstore.
In the Project Properties dialog box, set the Symbol Path on the Debugging page to:
SRV*c:/localstore*http://msdl.microsoft.com/download/symbols
This string tells the debugger to use the symbol server to get symbols and create a local symbol server, where they will be copied. Now, when you press F5 on the minidump, the symbols are copied from the Microsoft Web site, copied to the local store, and then used by the debugger. After the first time you do this, your performance will be quicker, because they will be retrieved from the local store rather than from the Web.
When debugging a non-Microsoft application, you should use a combination of methods A and B. Use A to get the system components and add paths to your bits and symbols by separating them with semicolons, such as:
c:/drop/build/myapp;SRV*c:/localstore*http://msdl.microsoft.com/download/symbols
Because the symbol server is an undocumented feature of Visual Studio .NET, there is no error reporting. If the syntax is incorrect or Symsrv.dll is not on the path, the symbols will fail to load with the error "No symbols loaded". You can also use symbol servers to store and retrieve binaries, but the MODPATH syntax needs to use symsrv*symsrv.dll* instead of SRV*.
Note The Microsoft symbol server does not contain binary files, but any symbol servers that you create can.
Symbol servers work for "live" debugging, as well, not only for minidumps. To do this, you will need to set the Symbol Path on the Debugging page properly.
How Microsoft Uses Minidumps
Microsoft has been using minidumps to improve the quality of its applications for more than a year. Microsoft Internet Explorer 5.5 and Microsoft Office XP were the first products to ship with the new Dr. Watson, a utility that catches when an application stops responding, creates a minidump, and asks the user if he or she wants to submit the information to Microsoft.
If the user clicks Send Error Report, then Dr. Watson creates and submits the minidump to a server on the Microsoft Web site. The utility performs the user prompting and minidump saving in a different process, which is spawned from the crashing process. This places less demand on the crashed application, increasing the chances of getting a valid minidump from the user.
Further Improvements
On the server side, the minidumps are analyzed into areas of similar crashes, based on where the crash occurred and in what component. This gives product teams statistics of how often the application crashed and how often a given crash occurs. The teams also receive the actual minidumps of the crashes for further investigation. In some cases where the crash is fully understood, users are automatically directed to a Web page that contains information about a known workaround or contains a fix to correct the problem. Since the release of Internet Explorer 5.5 and Office XP, many other product teams use similar technology to gather crash information. It is also a standard part of Windows XP.
The sample discussed in this article provides a basis for understanding minidumps. The sample does not discuss retrieving the dump file from the user. In the simplest case, the user can be prompted to send the minidump by e-mail. Also, potential privacy issues can occur, because user data may be present on the stack and is guaranteed to be present in a minidump that includes the full heap. This should be made clear to users. The Microsoft data collection policy, which also contains additional information about the exact contents of minidumps, is at http://watson.microsoft.com/dw/1033/dcp.asp.
In addition, the creation of minidumps from a Windows service that has an unhandled exception poses additional challenges, to do with desktop access (for example, if no one is using the console, then you cannot prompt them) and security contexts.
Conclusion
Minidumps are a new technology to port-mortem debug crashes on user workstations. It is easy to add code to existing applications to automatically create them when an unhandled exception occurs. Visual Studio .NET can easily read them back to recreate the crash and allow the developer to debug the problem. Symbol server can be used to make it much easier to find system symbols to aid in this analysis.


 5051
5051

 被折叠的 条评论
为什么被折叠?
被折叠的 条评论
为什么被折叠?
 到【灌水乐园】发言


