-
optimizer_index_caching
-
optimizer_index_cost_adj
-
optimizer_max_permutations
-
optimizer_search_limit
Also, check out v$event_histogram tips and a script to measure disk speed for sequential vs. scattered reads and estimate astarting value for optimizer_index_cost_adj.
Using optimizer_index_cost_adj
The optimizer_index_cost_adjparameter was created to allow use to change the relative costs of full-scan versus index operations. This is the most important parameter of all, and the default setting of 100 is incorrect for most Oracle systems. For some OLTP systems, re-setting this parameter to a smaller value (between 10- to 30) may result in huge performance gains!
10g Note: In Oracle 10g, you can achieve a similar result to reducing the value ofoptimizer_index_cost_adj by analyzing your workload statistics (dbms_stats.gather_system_stats). Also note that utilizing CPU costing (_optimizer_cost_model) may effect the efficiency of plans with lower values foroptimizer_index_cost_adj.
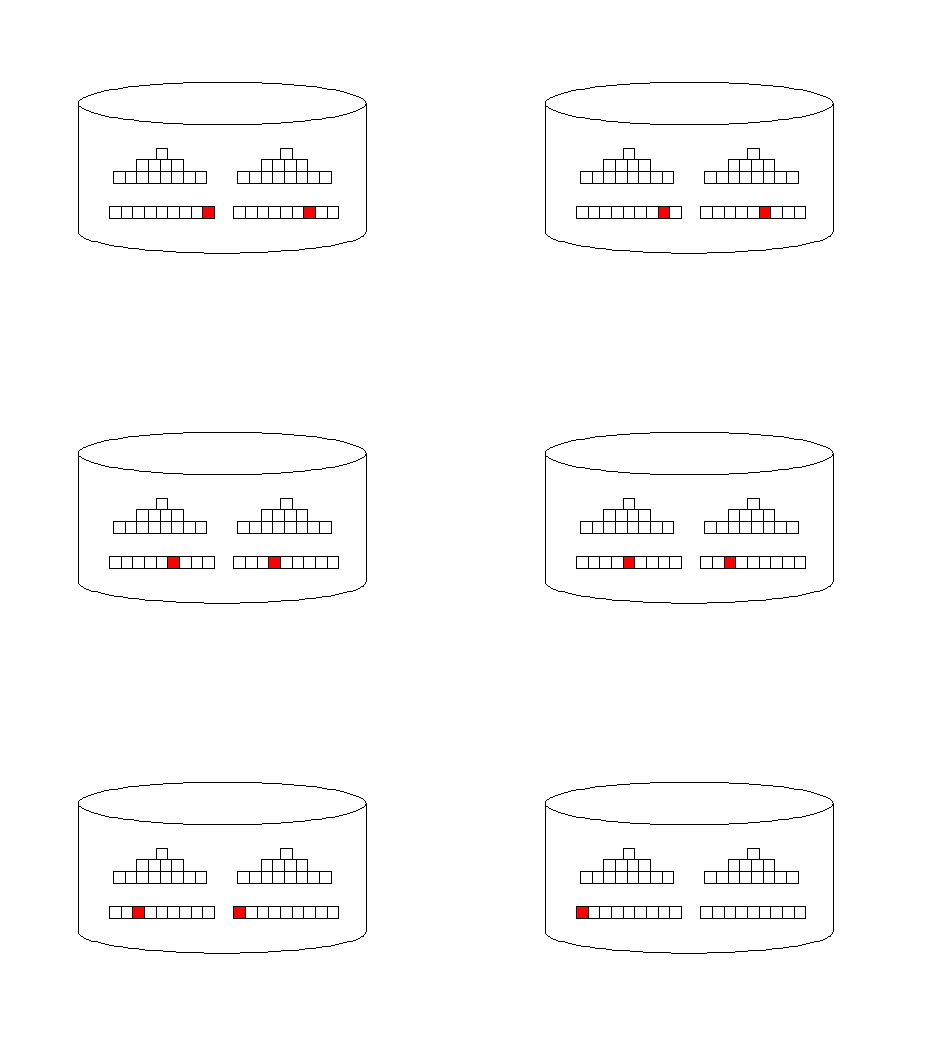
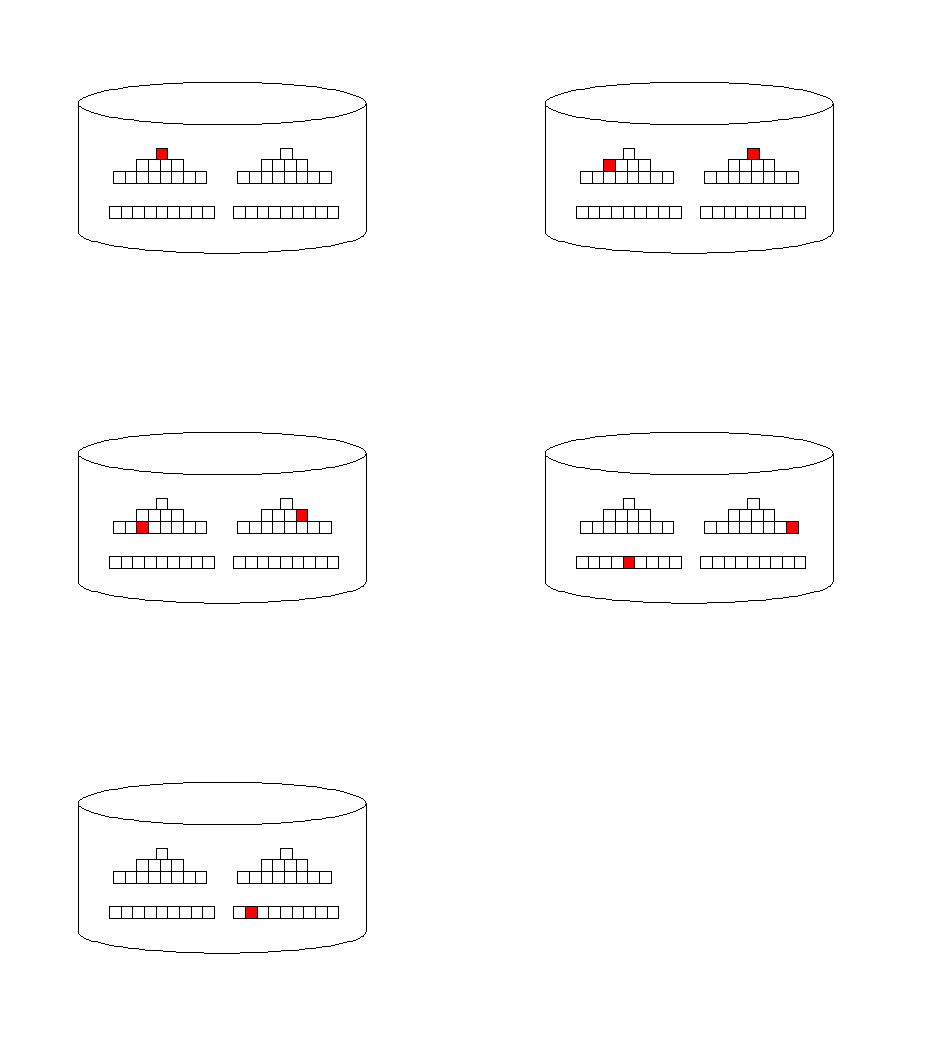
Remember, the all_rows optimizer mode is designed to minimize computing resources and it favors full-table scans. Index access (first_rows) adds additional I/O overhead, but they return rows faster, back to the originating query:
Oracle full-table scan Illustration

Oracle Index access illustration
If you are having slow performance because the CBO first_rows optimizer mode is favoring too many full-table scans, you can reduce the value of the optimizer_index_cost_adj parameter to immediately tune all of the SQL in your database to favor index scans over full-table scans. This is sometimes a “silver bullet” that can improve the performance of an entire database in cases where the database is OLTP and you have verified that the full-table scan costing is too low.
Is re-setting optimizer_index_cost_adj still required in 11g?
There is some debate on whether optimizer_index_cost_adj needs to be changed in 10g and 11g, with conflicting reports from the end-user community. Some claim that adding specialized CBO statistics (i.e. histograms) will alleviate the need to change the default values for optimizer_index_cost_adj, while others note that numerous bugs and other issues require that optimizer_index_cost_adj be changed in order for all relevant indexed to be invoked. Oracle has created tools such as the 11g SQL Performance Analyzer solely for testing the values of different initialization parameters. Ryan Gaffuri published these notes on using Optimizer_index_cost_adj. Oracle support(without knowing anything about my system) is telling me to usethe following settings:
OPTIMIZER_INDEX_CACHING = 50
OPTIMIZER_INDEX_COST_ADJ = 5
Tom Kyte's book effective Oracle by Design recommends starting
optimizer_index_caching at my cache/hit ratio and adjusting as needed.
Tim Gorman's paper 'Search for Intelligent Life in the Cost-Based Optimizer' states that OPTIMIZER_INDEX_COST_ADJ should be set between 10 and 50 for most OLTPs.
Also, see these notes in Oracle 10g upgrade optimization.
This documentshows some parameters which relieved slow SQL performance after a 10g upgrade by George Johnson:
After our upgrade from 9206 to 10201, we ended up with these parameters making the biggest difference to our slow query performance. Theoptimizer_index_cost_adj figure was arrived at after about 2 days of testing various troublesome
queries.optimizer_secure_view_merging = false
_gby_hash_aggregation_enabled = FALSE
optimizer_index_cost_adj = 50
optimizer_index_caching = 0
_optimizer_cost_based_transformation = OFFWe were told by one Oracle guy that if your DB is not a warehouse and it's used batch and OLTP, the bottom four parameters should be set in 10g, without question to ensure the Warehouse components do not affect OLTP type activity!
The optimizer_index_cost_adj parameter is an initialization parameter that can be very useful for SQL tuning. It is a numeric parameter with values from zero to 10,000 and a default value of 100. It can also be enabled at the session level by using the alter session set optimizer_index_cost_adj = nn syntax. This parameter lets you tune the optimizer behavior for access path selection to be more or less index friendly, and it is very useful when you feel that the default behavior for the CBO favors full-table scans over index scans.
If your response time is critical, you want to ensure that Oracle always uses index access to fetch rows as quickly as possible, but on some servers, a full-table scan may be faster than index access. Essentially, the CBO's choice about index vs. full-scan access depends on the relative costs of each type of operation.
The default value for optimizer_index_cost_adj is 100, and any value less than 100 makes the CBO view indexes as less expensive. If you do not like the propensity of the CBO "choose"optimizer_mode parameter to favor full-table scans, you can lower the value ofoptimizer_index_cost_adj to 20, thereby telling the CBO to give a lower cost to index scans over full-table scans.
Even in Oracle9i, the CBO sometimes falsely determines that the cost of full-table scan is less than the cost of an index access. Theoptimizer_index_cost_adjparameter is a great approach to whole-system SQL tuning, but you will need to evaluate the overall effect by slowly resetting the value down from 100 and observing the percentage of full-tale scans.
You can also slowly bump down the value ofoptimizer_index_cost_adj when you bounce the database and then either use theaccess.sqlor plan9i.sql scripts or reexamine SQL from the STATSPACKstats$sql_summary table to see the net effect of index scans on the whole database.
Determining a starting value for optimizer_index_cost_adj
We can see that the optimal setting foroptimizer_index_cost_adj is partially a function of the I/O waits for sequential reads vs. scattered reads:
In Oracle 10g and bwyond, you can use this script using thedba_hist_system_event table:
col c1 heading 'Average Waits for|Full Scan Read I/O' format 9999.999col c2 heading 'Average Waits for|Index Read I/O' format 9999.999
col c3 heading 'Percent of| I/O Waits|for scattered|Full Scans' format 9.99
col c4 heading 'Percent of| I/O Waits|for sequential|Index Scans' format 9.99
col c5 heading 'Starting|Value|for|optimizer|index|cost|adj' format 999 select
sum(a.time_waited_micro)/sum(a.total_waits)/1000000 c1,
sum(b.time_waited_micro)/sum(b.total_waits)/1000000 c2,
(
sum(a.total_waits) /
sum(a.total_waits + b.total_waits)
) * 100 c3,
(
sum(b.total_waits) /
sum(a.total_waits + b.total_waits)
) * 100 c4,
(
sum(b.time_waited_micro) /
sum(b.total_waits)) /
(sum(a.time_waited_micro)/sum(a.total_waits)
) * 100 c5
from
dba_hist_system_event a,
dba_hist_system_event b
where
a.snap_id = b.snap_id
and
a.event_name = 'db file scattered read'
and
b.event_name = 'db file sequential read';
Here is sample output from a real system showing an empirical test of disk I/O speed. We always expert scattered reads (full-table scans) to be far faster than sequential reads (index probes) because of Oracle sequential prefetch (see db_file_multiblock_read_count): - scattered read (full table scans) are fast at 13ms (c3)
- sequential reads (index probes) take much longer 86ms (c4) - starting setting for optimizer_index_cost_adj at 36:
C1 C2 C3 C4 C5
---------- ---------- ---------- ---------- ----------
13,824 5,072 13 86 36
Here is another variant, showing changes to optimizer_index_cost_adj wait components over time:
set pages 80
set lines 130
col c1 heading 'Average Waits for|Full Scan Read I/O' format 999999.999
col c2 heading 'Average Waits for|Index Read I/O' format 999999.999
col c3 heading 'Percent of| I/O Waits|for scattered|Full Scans' format
999.99
col c4 heading 'Percent of| I/O Waits|for sequential|Index Scans' format
999.99
col c5 heading 'Starting|Value|for|optimizer|index|cost|adj' format 99999
select a.snap_id "Snap",
sum(a.time_waited_micro)/sum(a.total_waits)/10000 c1,
sum(b.time_waited_micro)/sum(b.total_waits)/10000 c2,
(sum(a.total_waits) / sum(a.total_waits + b.total_waits)) * 100 c3,
(sum(b.total_waits) / sum(a.total_waits + b.total_waits)) * 100 c4,
(sum(b.time_waited_micro)/sum(b.total_waits)) /
(sum(a.time_waited_micro)/sum(a.total_waits)) * 100 c5
from
dba_hist_system_event a,
dba_hist_system_event b
where a.snap_id = b.snap_id
and a.event_name = 'db file scattered read'
and b.event_name = 'db file sequential read'
See code depot for full script
/
Snap Full Scan Read I/O Index Read I/O Full Scans Index Scans
---------- ------------------ ----------------- ------------- --------------
5079 .936 .074 10.14 89.86
5080 .936 .074 10.14 89.86
5081 .936 .074 10.14 89.86
5082 .936 .074 10.14 89.86
5083 .936 .074 10.13 89.87
5084 .936 .074 10.13 89.87
5085 .936 .074 10.13 89.87
Here is yet another script that aggregates the I/O wait times by day:
set pages 80
set lines 130
col c1 heading 'Average Waits for|Full Scan Read I/O' format 999999.999
col c2 heading 'Average Waits for|Index Read I/O' format 999999.999
col c3 heading 'Percent of| I/O Waits|for scattered|Full Scans' format
999.99
col c4 heading 'Percent of| I/O Waits|for sequential|Index Scans' format
999.99
col c5 heading 'Starting|Value|for|optimizer|index|cost|adj' format 99999
select to_char(end_interval_time, 'MM/DD/YYYY') "Date",
sum(a.time_waited_micro)/sum(a.total_waits)/10000 c1,
sum(b.time_waited_micro)/sum(b.total_waits)/10000 c2,
(sum(a.total_waits) / sum(a.total_waits + b.total_waits)) * 100 c3,
(sum(b.total_waits) / sum(a.total_waits + b.total_waits)) * 100 c4,
(sum(b.time_waited_micro)/sum(b.total_waits)) /
(sum(a.time_waited_micro)/sum(a.total_waits)) * 100 c5
from dba_hist_system_event a, dba_hist_system_event b, dba_hist_snapshot c
See code depot for full script
/
Percent of Percent of optimizer
I/O Waits I/O waits index
Average Waits for Average Waits for for scattered for sequential cost
Date Full Scan Read I/O Index Read I/O Full Scans Index Scans adj
---------- ------------------ ----------------- ------------- -------------- ---------
08/10/2006 .901 .119 15.63 84.37 13
08/11/2006 .900 .118 15.54 84.46 13
08/12/2006 .898 .113 14.96 85.04 13
08/13/2006 .910 .103 13.77 86.23 11
08/14/2006 .993 .076 10.64 89.36 8
08/15/2006 .991 .076 10.61 89.39 8
For a more comprehensive analysis of optimizer_index_cost_adj, Oracle data warehouse expert Tim Gorman has also published a sophisticated script to predict a suggestedstarting value for optimizer_index_cost_adj using historical STATSPACK (and AWR) time-series data. Gorman notes:
There is a SQL statementin that paper which suggests calculating the proper value for O_I_C_A using information stored in the V$SYSTEM_EVENT view. However, since the information in that view is summarized over a long period of time, better information might be obtained from the corresponding STATSPACK table (STATS$SYSTEM_EVENT, populated from snapshots from V$SYSTEM_EVENT) to display changes to the timing information over time. This report calculates a recommended O_I_C_A value using sampled information summarized first by day, and then later by hour.
The plan9i.sql script (see code depot from book below) uses thev$sql_plan view and a quickly the reduction in sub-optimal, large-table full-table scans:
Full table scans and counts
Note that "K" indicates in the table is in the KEEP pool.
OWNER NAME NUM_ROWS C K BLOCKS NBR_FTS
-------------- ------------------------ --------- - - -------- --------
SYS DUAL N 2 97,237
SYSTEM SQLPLUS_PRODUCT_PROFILE N K 2 16,178
DONALD PAGE 3,450,209 N 932,120 9,999
DONALD RWU_PAGE 434 N 8 7,355
DONALD PAGE_IMAGE 18,067 N 1,104 5,368
DONALD SUBSCRIPTION 476 N K 192 2,087
DONALD PRINT_PAGE_RANGE 10 N K 32 874
ARM JANET_BOOKS 20 N 8 64


 213
213

 被折叠的 条评论
为什么被折叠?


