


前面一篇文章:
ASP.NET MVC 3 Beta初体验之WebGrid介绍了WebGrid控件的使用,ASP.NET MVC 3 Beta中才内置Chart的。这篇文章中将介绍Chart的使用。包括Chart数据源的配置、Chart的显示、Chart保存三个方面。Chart是很多系统中使用,所以在ASP.NET MVC 3 Beta初体验之中介绍它是很有必要的。
1、配置Chart的数据源
给Chart配置数据源大概有三种方式。
第一种:使用数组
示例:
Controller代码:
public
ActionResult BasicChart()
{
return View();
}
{
return View();
}
BasicChart.cshtml代码:
< p >
@{
var key = new Chart(width: 600 , height: 400 )
.AddTitle( " 人员流动情况 " )
.AddSeries(name: " Employee " ,xValue: new [] { " 一月份 " , " 二月份 " , " 三月份 " , " 四月份 " , " 五月份 " , " 六月份 " , " 七月份 " , " 八月份 " , " 九月份 " }, yValues: new [] { " 2 " , " 6 " , " 4 " , " 5 " , " 3 " , " 4 " , " 9 " , " 2 " , " 5 " })
.Write();
}
</ p >
从上面代码可以看到,我给 Chart的xValue配置了一个数组,相应的yValue也配置了一个相应的数组。
运行效果:
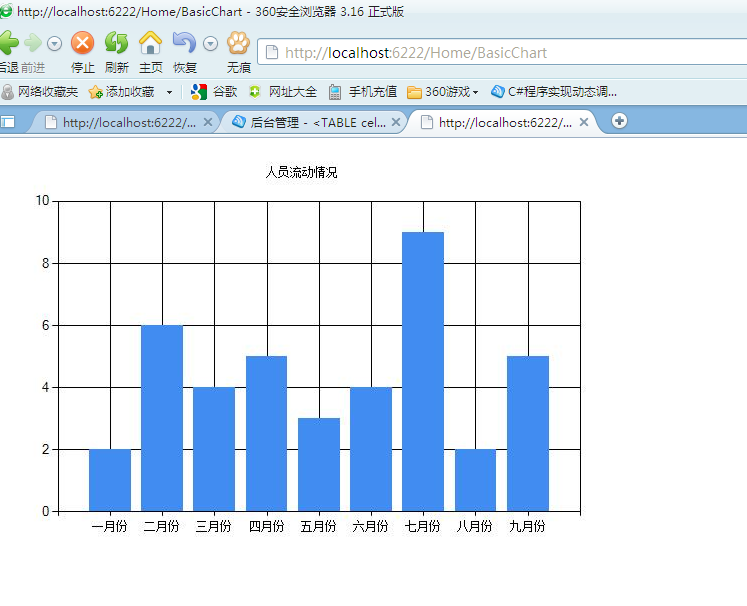
此时,我们发现这个图形是单独显示的,没有站点的样式和母版。下面实现将这个图形显示在一个页面中。
定义一个Action:
public
ActionResult ShowBasicChart()
{
return View();
}
{
return View();
}
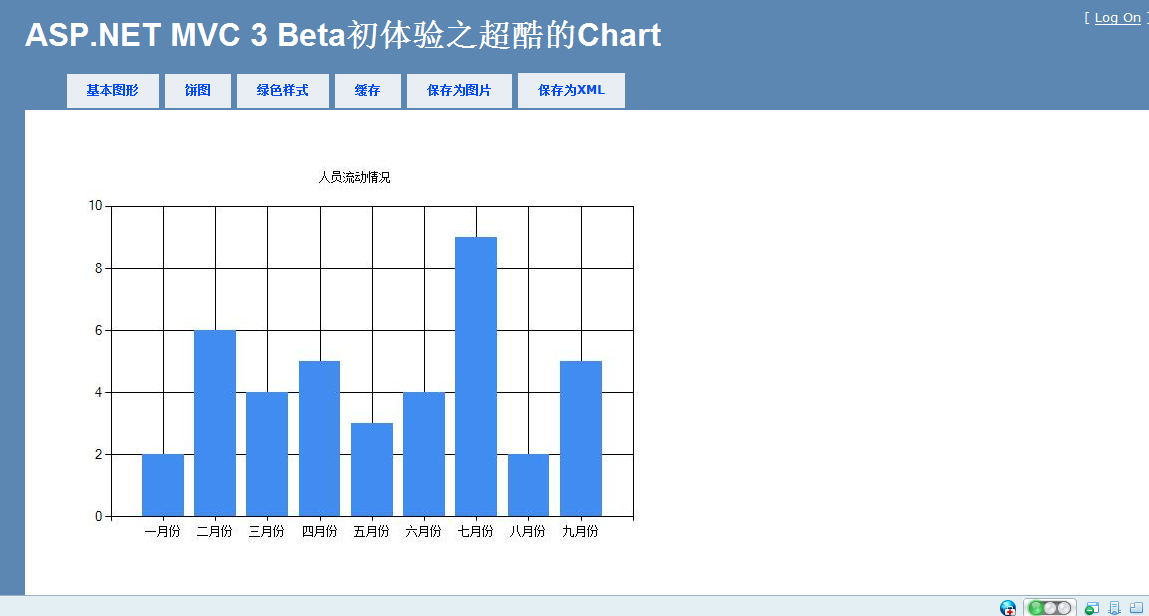
View代码:定义一个img标签,将src改成生成图片的action。
<
p
><
img
src
="BasicChart"
/>
</
p
>
效果:有了站点样式和母板:
第二种方式:数据库查询
示例:
@{ var db
=
Database.Open(
"
SmallBakery
"
);
var data = db.Query( " SELECT Month, Number FROM Employee " );
var key = new Chart(width: 600 , height: 400 )
.AddTitle( " 人员流动 " )
.DataBindTable(dataSource: data, xField: " Month " )
.Write(); }
var data = db.Query( " SELECT Month, Number FROM Employee " );
var key = new Chart(width: 600 , height: 400 )
.AddTitle( " 人员流动 " )
.DataBindTable(dataSource: data, xField: " Month " )
.Write(); }
第三种方式:XML
示例:
@using System.Data; @{
var dataSet = new DataSet();
dataSet.ReadXmlSchema(Server.MapPath( " ~/App_Data/data.xsd " ));
dataSet.ReadXml(Server.MapPath( " ~/App_Data/data.xml " ));
var dataView = new DataView(dataSet.Tables[ ]);
var key = new Chart(width: 600 , height: 400 )
.AddTitle( " Sales Per Employee " )
.AddSeries( " Default " , chartType: " Pie " ,
xValue: dataView, xField: " Name " ,
yValues: dataView, yFields: " Sales " )
.Write();
}
由于这三种方式都类似,了解其中一种,其余的类似,就不细说了,为了简单起见,下面的例子都是用数组的方式来实现。
2、Chart的显示:
chartType属性:它有一个chartType属性,可以定义显示的方式。比如将上面的例子的chartType定义为"Pie",就显示为饼图。
@{
var key = new Chart(width: 600 , height: 400 )
.AddTitle( " 人员流动情况 " )
.AddSeries(name: " Employee " ,chartType: " Pie " , xValue: new [] { " 一月份 " , " 二月份 " , " 三月份 " , " 四月份 " , " 五月份 " , " 六月份 " , " 七月份 " , " 八月份 " , " 九月份 " }, yValues: new [] { " 2 " , " 6 " , " 4 " , " 5 " , " 3 " , " 4 " , " 9 " , " 2 " , " 5 " })
.Write();
}
效果:

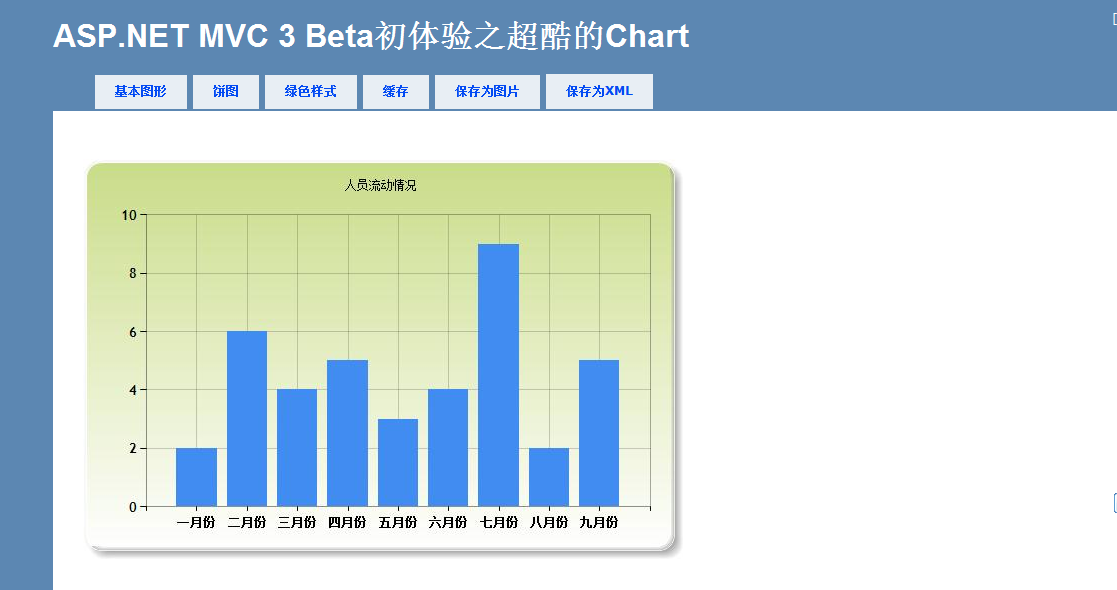
template属性:它可以定义背景模板,如修改代码为:template: ChartTheme.Green

 代码
代码
@{
var key = new Chart(width: 600 , height: 400 ,template: ChartTheme.Green)
.AddTitle( " 人员流动情况 " )
.AddSeries(name: " Employee " ,xValue: new [] { " 一月份 " , " 二月份 " , " 三月份 " , " 四月份 " , " 五月份 " , " 六月份 " , " 七月份 " , " 八月份 " , " 九月份 " }, yValues: new [] { " 2 " , " 6 " , " 4 " , " 5 " , " 3 " , " 4 " , " 9 " , " 2 " , " 5 " })
.Write();
}
效果:
3、Chart保存
将Chart保存到缓存中:看下面代码:
代码
@{
var chartKey = Request[ " key " ];
if (chartKey != null )
{
var cachedChart = Chart.GetFromCache(key: chartKey);
if (cachedChart == null )
{
cachedChart = new Chart( 600 , 400 );
cachedChart.AddTitle( " Cached Chart -- Cached at " + DateTime.Now);
cachedChart.AddSeries(
name: " Employee " ,
axisLabel: " Name " ,
xValue: new [] { " 一月份 " , " 二月份 " , " 三月份 " , " 四月份 " , " 五月份 " , " 六月份 " , " 七月份 " , " 八月份 " , " 九月份 " },
yValues: new [] { " 2 " , " 6 " , " 4 " , " 5 " , " 3 " , " 4 " , " 9 " , " 2 " , " 5 " });
cachedChart.SaveToCache(key: chartKey,minutesToCache: 2 ,slidingExpiration: false );
}
Chart.WriteFromCache(chartKey);
}
}
Chart.GetFromCache(key: chartKey)将根据key从缓存中取出Chart,cachedChart.SaveToCache(key: chartKey,minutesToCache: 2,slidingExpiration: false)是将Chart缓存起来。看下图:
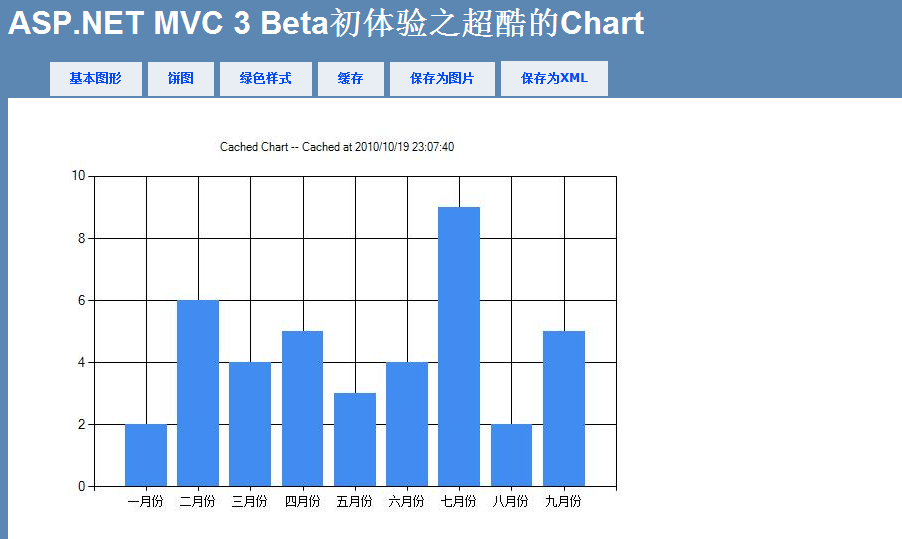
当再次请求的时候,就直接从缓存中取数据。设置缓存两分钟,两分钟之后这次的缓存失效。
将Chart保存为图片:
使用下面代码将图形保存为图片:
@{
var filePathName = " _ChartFiles/chart01.jpg " ;
if ( ! File.Exists(Server.MapPath(filePathName)))
{
var chartImage = new Chart( 600 , 400 );
chartImage.AddTitle( " Chart Title " );
chartImage.AddSeries(
name: " Employee " ,
axisLabel: " Name " ,
xValue: new [] { " 一月份 " , " 二月份 " , " 三月份 " , " 四月份 " , " 五月份 " , " 六月份 " , " 七月份 " , " 八月份 " , " 九月份 " },
yValues: new [] { " 2 " , " 6 " , " 4 " , " 5 " , " 3 " , " 4 " , " 9 " , " 2 " , " 5 " });
chartImage.Save(path: filePathName);
}
}
保存之后的图片:
将Chart保存为保存为XML:
@{ Chart chartXml;
var filePathName = " _ChartFiles/XmlChart.xml " ;
if (File.Exists(Server.MapPath(filePathName)))
{
chartXml = new Chart(width: 600 ,height: 400 ,templatePath: filePathName);
}
else {
chartXml = new Chart(width: 600 ,height: 400 );
chartXml.AddTitle( " Chart Title -- Saved at " + DateTime.Now);
chartXml.AddSeries(
name: " Employee " ,
axisLabel: " Name " ,
xValue: new [] { " 一月份 " , " 二月份 " , " 三月份 " , " 四月份 " , " 五月份 " , " 六月份 " , " 七月份 " , " 八月份 " , " 九月份 " },
yValues: new [] { " 2 " , " 6 " , " 4 " , " 5 " , " 3 " , " 4 " , " 9 " , " 2 " , " 5 " });
chartXml.SaveXml(path: filePathName);
}
chartXml.Write();
}
从上面代码我们可以看到,可以通过templatePath将XML转换成Chart。通过SaveXml可以将Chart保存为XML。生成的XML如下:
代码
<
Chart
Width
="600"
Height
="400"
>
< Series >
< Series Name ="Employee" XValueType ="String" YValueType ="String" ChartArea ="Default" AxisLabel ="Name" >
< Points >
< DataPoint YValues ="2" AxisLabel ="一月份" />
< DataPoint YValues ="6" AxisLabel ="二月份" />
< DataPoint YValues ="4" AxisLabel ="三月份" />
< DataPoint YValues ="5" AxisLabel ="四月份" />
< DataPoint YValues ="3" AxisLabel ="五月份" />
< DataPoint YValues ="4" AxisLabel ="六月份" />
< DataPoint YValues ="9" AxisLabel ="七月份" />
< DataPoint YValues ="2" AxisLabel ="八月份" />
< DataPoint YValues ="5" AxisLabel ="九月份" />
</ Points >
</ Series >
</ Series >
< ChartAreas >
< ChartArea Name ="Default" >
</ ChartArea >
</ ChartAreas >
< Titles >
< Title Name ="Title1" Text ="Chart Title -- Saved at 2010/10/19 23:41:02" >
</ Title >
</ Titles >
</ Chart >
总结:本文就三个方面介绍了ASP.NET MVC 3 Beta中的Chart。包括它的数据源配置、显示以及保存。
原文链接: http://www.cnblogs.com/zhuqil/archive/2010/10/20/asp-net-mvc-3-chart.html


 134
134

 被折叠的 条评论
为什么被折叠?
被折叠的 条评论
为什么被折叠?
 到【灌水乐园】发言


