


- elk简介:
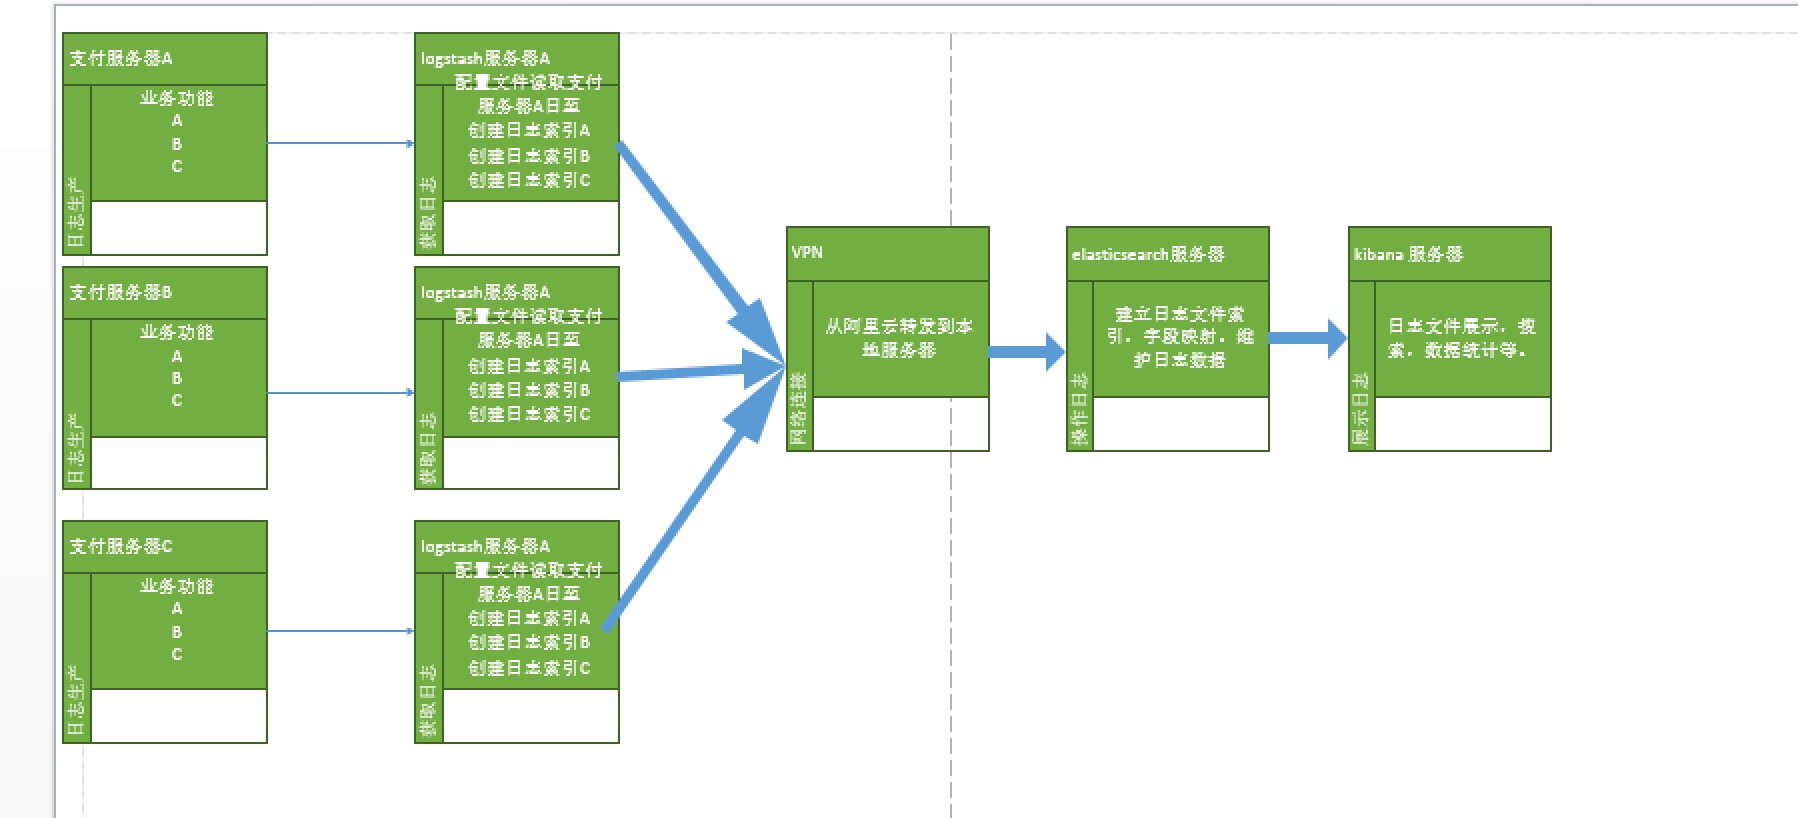
E:Elasticsearch 开源的分布式搜索引擎,提供搜索、分析、存储数据的三大功能。特点是:分布式、自动发现、索引自动分片、索引副本机制、ResetFul 风格接口、多数据源以及自动搜索负载等。 L:Logstash 是一个开源的用来收集、解析、过滤日志的工具。支持几乎任何类型的日志,包括系统日志、业务日志和安全日志。它可以从许多来源接收日志,这些来源主要包括 Syslog、消息传递(例如 RabbitMQ)和 Filebeat;能够以多种方式输出数据,这些方式主要包括电子邮件、WebSockets 和 Elasticsearch。 k:Kibana 是一个基于 Web 的友好图形界面,用于搜索、分析和可视化存储在 Elasticsearch 中的数据。它利用 Elasticsearch 的 RESTful 接口来检索数据,不仅允许用户定制仪表板视图,还允许他们以特殊的方式查询、汇总和过滤数据。 逻辑图如下:(https://static.oschina.net/uploads/img/201712/15142342_IMmh.png)
2. elk配置
   ELK有两种安装方式
  (1)集成环境:Logstash有一个集成包,里面包括了全套的三个组件,也就是安装一个集成包。
  (2)独立环境:三个组件分别单独安装、运行、各司其职。(比较常用)
   采用第二种方式:具体功能如下描述:
Elasticsearch:部署完成后,需要更改 elasticsearch.yml 配置文件中的主要属性:cluster.name、node.name、network.host、discovery.zen.ping.unicast.hosts。其中,当部署 Elasticsearch 时是以集群模式部署的,那么 discovery.zen.ping.unicast.hosts 这个属性才会需要被配置。
   Logstash: 通过配置 filebeat-pipeline.conf 文件中的 Input、Filter(可选)和 Output 来完成对数据的采集、过滤和输出。然后以 filebeat-pipline.conf 文件启用 Logstash 服务。
   Kibana:通过更改 kibana.yml 配置文件内容,用来连接正确的 Elasticsearch 服务地址,通常只需要配置 elasticsearch.url 属性即可,请见下图的第一个图。配置完成后,执行【bin/kibana &】命令启用 Kibana 服务,请见下图的第二个图。最后就可以在浏览器中打开 Kibana 管理页面(访问地址:http://139.198.13.12:4800/)来查看日志
3.安装过程:

  一:.jdk1.8安装略过。。
  二:. 下载部署搜集日志:logstash https://artifacts.elastic.co/downloads/logstash/logstash-6.0.0.tar.gz
  三:.下载存储、搜索Elasticsearch:https://artifacts.elastic.co/downloads/elasticsearch/elasticsearch-6.0.0.tar.gz
  四:.下载web Kibana: 分为mac、win、linux系统,这里下载linux。 https://artifacts.elastic.co/downloads/kibana/kibana-6.0.0-linux-x86_64.tar.gz

 五:.安装logstash:解压logstash 配置环境变量
  echo "export PATH=$PATH:/usr/local/logstash/bin" > /etc/profile.d/logstash.sh
 进入 logstash-XXX/config/下
logstash.yml 配置文件  startup.options 启动信息
配置文件信息参考:https://www.elastic.co/guide/en/logstash/6.0/config-setting-files.html

启动logstash 在bin目录下 有启动参数,请参考文档,抽取描述如下:
-n, --node.name NAME          Specify the name of this logstash instance, if no value is given
                                  it will default to the current hostname.
                                   (default: "wodezuiaishinagerendeMacBook-Pro.local")
    -f, --path.config CONFIG_PATH Load the logstash config from a specific file
                                  or directory.  If a directory is given, all
                                  files in that directory will be concatenated
                                  in lexicographical order and then parsed as a
                                  single config file. You can also specify
                                  wildcards (globs) and any matched files will
                                  be loaded in the order described above.
    -e, --config.string CONFIG_STRING Use the given string as the configuration
                                  data. Same syntax as the config file. If no
                                  input is specified, then the following is
                                  used as the default input:
                                  "input { stdin { type => stdin } }"
                                  and if no output is specified, then the
                                  following is used as the default output:
                                  "output { stdout { codec => rubydebug } }"
                                  If you wish to use both defaults, please use
                                  the empty string for the '-e' flag.
                                   (default: nil)
    --modules MODULES             Load Logstash modules.
                                  Modules can be defined using multiple instances
                                  '--modules module1 --modules module2',
                                     or comma-separated syntax
                                  '--modules=module1,module2'
                                  Cannot be used in conjunction with '-e' or '-f'
                                  Use of '--modules' will override modules declared
                                  in the 'logstash.yml' file.
    -M, --modules.variable MODULES_VARIABLE Load variables for module template.
                                  Multiple instances of '-M' or
                                  '--modules.variable' are supported.
                                  Ignored if '--modules' flag is not used.
                                  Should be in the format of
                                  '-M "MODULE_NAME.var.PLUGIN_TYPE.PLUGIN_NAME.VARIABLE_NAME=VALUE"'
                                  as in
                                  '-M "example.var.filter.mutate.fieldname=fieldvalue"'

读取日志文件时 需要配置conf 文件 分为 文件file、tcp、log4j、http等log4j最新的版本中好像已经废弃
比如读取本地tomcat 日志XXX.conf 配置:

input {#输入
  file {
    path => ["apachlog1","apachlog2"]
    type => 'ceshi'
  }
}
#过滤参考官方说明 好多
filter {
    if [type] == "Tomcat" {
           grok {
                match => {"message" => "%{TIMESTAMP_ISO8601:timestamp} %{LOGLEVEL:level}%{JAVALOGMESSAGE:msg}"}
                }
            date {
                 match => [ "timestamp" , "yyyy-MM-dd HH:mm:ss,S", "ISO8601" ]
             }
  }
}
#输出到elasticsearch
output {
  elasticsearch {
    action => "index" 建立索引
    hosts => "192.168.156.215:9200" elasticsearch 服务地址
    index => "apache" 索引名称
  }
#输出到控制台
 stdout {
           codec => rubydebug
        }
}

启动命令 bin/logstash -f XXX.conf

如果输入和输出为多个文件

请在配置文件中利用input中的type配置项进行判断

实例如下:
input{
    file{
        path=>[
            "1.log"
        ]
        type => "1"
        #tags => ["from_sys"]
    }
}

## in2.conf内容如下:
input{
    file{
        path=>[
            "2.log"
        ]
        type => "2"
        #tags => ["from_sys"]
    }
}

## out1.conf如下
if [type] == "1"{
#if "from_sys" in [tags]
    elasticsearch {
        action => "index"
        hosts  => "localhost:9200"
        index  => "from_sys_log"
        codec => "json"
    }
}
## out2.conf如下
if [type] == "2"{
#if "from_error" in [tags]
    elasticsearch {
        action => "index"
        hosts  => "localhost:9200"
        index  => "from_error_log"
        codec => "json"
    }
}


 六:.安装elasticsearch:解压elasticsearch 配置环境变量类似第五步

进入conf 配置文件:elasticsearch.yml

配置文件详解

配置文件位于es根目录的config目录下面,有elasticsearch.yml和logging.yml两个配置,主配置文件是elasticsearch.yml,日志配置文件是logging.yml,elasticsearch调用log4j记录日志,所以日志的配置文件可以按照默认的设置,我来介绍下elasticsearch.yml里面的选项。

cluster.name: elasticsearch
配置的集群名称,默认是elasticsearch,es服务会通过广播方式自动连接在同一网段下的es服务,通过多播方式进行通信,同一网段下可以有多个集群,通过集群名称这个属性来区分不同的集群。

node.name: "Franz Kafka"
当前配置所在机器的节点名,你不设置就默认随机指定一个name列表中名字,该name列表在es的jar包中config文件夹里name.txt文件中,其中有很多作者添加的有趣名字。

node.master: true
指定该节点是否有资格被选举成为node(注意这里只是设置成有资格, 不代表该node一定就是master),默认是true,es是默认集群中的第一台机器为master,如果这台机挂了就会重新选举master。

node.data: true
指定该节点是否存储索引数据,默认为true。

index.number_of_shards: 5
设置默认索引分片个数,默认为5片。

index.number_of_replicas: 1
设置默认索引副本个数,默认为1个副本。如果采用默认设置,而你集群只配置了一台机器,那么集群的健康度为yellow,也就是所有的数据都是可用的,但是某些复制没有被分配(

健康度可用 curl 'localhost:9200/_cat/health?v' 查看, 分为绿色、黄色或红色。绿色代表一切正常,集群功能齐全,黄色意味着所有的数据都是可用的,但是某些复制没有被分配,红色则代表因为某些原因,某些数据不可用)。
详细的健康检查:
level=indices
path.conf: /path/to/conf
设置配置文件的存储路径,默认是es根目录下的config文件夹。
path.data: /path/to/data
设置索引数据的存储路径,默认是es根目录下的data文件夹,可以设置多个存储路径,用逗号隔开,例:

path.data: /path/to/data1,/path/to/data2

path.work: /path/to/work
设置临时文件的存储路径,默认是es根目录下的work文件夹。

path.logs: /path/to/logs
设置日志文件的存储路径,默认是es根目录下的logs文件夹

path.plugins: /path/to/plugins
设置插件的存放路径,默认是es根目录下的plugins文件夹, 插件在es里面普遍使用,用来增强原系统核心功能。

bootstrap.mlockall: true
设置为true来锁住内存不进行swapping。因为当jvm开始swapping时es的效率 会降低,所以要保证它不swap,可以把ES_MIN_MEM和ES_MAX_MEM两个环境变量设置成同一个值,并且保证机器有足够的内存分配给es。 同时也要允许elasticsearch的进程可以锁住内存,linux下启动es之前可以通过`ulimit -l unlimited`命令设置。

network.bind_host: 192.168.0.1
设置绑定的ip地址,可以是ipv4或ipv6的,默认为0.0.0.0,绑定这台机器的任何一个ip。

network.publish_host: 192.168.0.1
设置其它节点和该节点交互的ip地址,如果不设置它会自动判断,值必须是个真实的ip地址。

network.host: 192.168.0.1
这个参数是用来同时设置bind_host和publish_host上面两个参数。

transport.tcp.port: 9300
设置节点之间交互的tcp端口,默认是9300。

transport.tcp.compress: true
设置是否压缩tcp传输时的数据,默认为false,不压缩。

http.port: 9200
设置对外服务的http端口,默认为9200。

http.max_content_length: 100mb
设置内容的最大容量,默认100mb

http.enabled: false
是否使用http协议对外提供服务,默认为true,开启。

gateway.type: local
gateway的类型,默认为local即为本地文件系统,可以设置为本地文件系统,分布式文件系统,hadoop的HDFS,和amazon的s3服务器等。

gateway.recover_after_nodes: 1
设置集群中N个节点启动时进行数据恢复,默认为1。

gateway.recover_after_time: 5m
设置初始化数据恢复进程的超时时间,默认是5分钟。

gateway.expected_nodes: 2
设置这个集群中节点的数量,默认为2,一旦这N个节点启动,就会立即进行数据恢复。

cluster.routing.allocation.node_initial_primaries_recoveries: 4
初始化数据恢复时,并发恢复线程的个数,默认为4。

cluster.routing.allocation.node_concurrent_recoveries: 2
添加删除节点或负载均衡时并发恢复线程的个数,默认为4。

indices.recovery.max_size_per_sec: 0
设置数据恢复时限制的带宽,如入100mb,默认为0,即无限制。

indices.recovery.concurrent_streams: 5
设置这个参数来限制从其它分片恢复数据时最大同时打开并发流的个数,默认为5。

discovery.zen.minimum_master_nodes: 1
设置这个参数来保证集群中的节点可以知道其它N个有master资格的节点。默认为1,对于大的集群来说,可以设置大一点的值(2-4)

discovery.zen.ping.timeout: 3s
设置集群中自动发现其它节点时ping连接超时时间,默认为3秒,对于比较差的网络环境可以高点的值来防止自动发现时出错。

discovery.zen.ping.multicast.enabled: false
设置是否打开多播发现节点,默认是true。

discovery.zen.ping.unicast.hosts: ["host1", "host2:port", "host3[portX-portY]"]
设置集群中master节点的初始列表,可以通过这些节点来自动发现新加入集群的节点。

network.host: 192.168.8.10 #注释去掉,修改为指定主机地址,其实可选,但最好指定因为后面跟kibana集成的时候会报http连接出错
http.port: 9200


启动elasticsearch 个人在ubuntu中遇到问题(mac中没有):

ERROR: [2] bootstrap checks failed
[1]: max file descriptors [4096] for elasticsearch process is too low, increase to at least [65536]
[2]: max virtual memory areas vm.max_map_count [65530] is too low, increase to at least [262144]

解决方法 修改下面的文件(网上有很多修改,还有root用户切换,对于我都是失败的,简单粗暴的设置了下面两句):
sudo vi  /etc/security/limits.conf
elasticsearch soft memlock unlimited
elasticsearch hard memlock unlimited

再次启动正常访问http://ip:9200 (网上有很多插件的安装,但是在新的版本中不在支持,这里不叙述插件的安装,也不叙述索引和mapping的概念)
?pretty
简单操作index 和mapping,我们在logstash中的XX.conf文件中 有action =》index 建立了索引

1.查看索引:
curl -XPUT "http://192.168.156.215:9200/indexname"
2.删除索引:
$ curl -XDELETE 'http://192.168.156.215:9200/indexname'
3.查看是否有mapping映射

curl -XGET "http://192.168.156.215:9200/indename/_mapping?pretty”(备注:?pretty ---》json格式化输出)

4.创建mapping

curl -XPUT "http://192.168.156.215:9200/indexname/_mapping?pretty”
{ "message" : { "mappings" : { "product" : { "properties" : { "createDate" : { "type" : "date", "format" : "strict_date_optional_time||epoch_millis" }, "description" : { "type" : "string", "index" : "not_analyzed" }, "onSale" : { "type" : "boolean" }, "price" : { "type" : "double" }, "title" : { "type" : "string", "store" : true }, "type" : { "type" : "integer" } } } } }}

4.修改mapping—> message(新的版本中type:String  被text取代)
curl -XPOST "http://192.168.156.215:9200/indexname/message/_mapping?pretty" -d '{ "message": { "properties": { "deleteDate":{ "type":"string" } } } }'


5.根据单个id 查询_id 值:AWApdirSVtJ1JKDoV1Qu  ;_type值logs
 curl -XGET 'http://192.168.156.215:9200/indexname/logs/AWApdirSVtJ1JKDoV1Qu’
6.模糊查询 deleteDate 日志中的字段
curl -l -H "Content-type: application/json" -X POST http://192.168.156.215:9200/indexname/logs/_search\?pretty  '{ "query": {"match": {"deleteDate": {"query":"20171206","fuzziness": "AUTO","operator":  "and" }}}}'

7.模糊删除所有数据

curl -l -H "Content-type: application/json" -X POST http://192.168.156.215:9200/indexname/logs/_delete_by_query\?pretty  '{ "query": {"match": {"deleteDate": {"query":"20171206","fuzziness": "AUTO","operator":  "and" }}}}'

8.根据7中的语句可以编写定期删除时间段日志 此处不做实例


集群配置:
两种集群配置 第一:多机务器集群; 第二:单机多节点(复制 改端口)


多机集群中的节点可以分为master nodes和data nodes,在配置文件中使用Zen发现(Zen discovery)机制来管理不同节点。Zen发现是ES自带的默认发现机制,使用多播发现其它节点。只要启动一个新的ES节点并设置和集群相同的名称这个节点就会被加入到集群中。


Elasticsearch集群中有的节点一般有三种角色:master node、data node和client node。

1. master node:master几点主要用于元数据(metadata)的处理,比如索引的新增、删除、分片分配等。
2. data node:data 节点上保存了数据分片。它负责数据相关操作,比如分片的 CRUD,以及搜索和整合操作。这些操作都比较消耗 CPU、内存和 I/O 资源;
3. client node:client 节点起到路由请求的作用,实际上可以看做负载均衡器。( 对于没有很多请求的业务,client node可以不加,master和data足矣)

集群部署算法如果有三个主要节点,则最小主节点应设置为(3 / 2) + 1或2:
discovery.zen.minimum_master_nodes:2


六:Kibana 安装,解压Kibana 配置环境变量同上

进入conf文件中:kibana.yml 编辑配置:
1.server.port: 5601
2.server.host: "localhost"
3.elasticsearch.url: "http://192.168.156.215:9200"
进入bin/目录启动


至此简单的安装配置完成,其它的进阶请参照官方和技术网站。


 3020
3020

 被折叠的 条评论
为什么被折叠?
被折叠的 条评论
为什么被折叠?
 到【灌水乐园】发言


