


作者简介:

张炎泼(XP)
白山云科技合伙人兼研发副总裁,绰号XP。
张炎泼先生于2016年加入白山云科技,主要负责对象存储研发、数据跨机房分布和修复问题解决等工作。以实现100PB级数据存储为目标,其带领团队完成全网分布存储系统的设计、实现与部署工作,将数据“冷”“热”分离,使冷数据成本压缩至1.2倍冗余度。
张炎泼先生2006年至2015年,曾就职于新浪,负责Cross-IDC PB级云存储服务的架构设计、协作流程制定、代码规范和实施标准制定及大部分功能实现等工作,支持新浪微博、微盘、视频、SAE、音乐、软件下载等新浪内部存储等业务;2015年至2016年,于美团担任高级技术专家,设计了跨机房的百PB对象存储解决方案:设计和实现高并发和高可靠的多副本复制策略,优化Erasure Code降低90%IO开销。
表现
运行环境:
# uname –a
Linux ** 3.10.0-327.el7.x86_64 #1 SMP Thu Nov 19 22:10:57 UTC 2015 x86_64 x86_64 x86_64 GNU/Linux
# python2 --version
Python 2.7.5
# cat /etc/*-release
CentOS Linux release 7.2.1511 (Core)
python进程在大量请求的处理过程中,内存持续升高。负载压力下降之后,内存并未下降。
# ps aux | grep python2
USER PID %CPU %MEM VSZ RSS TTY STAT START TIME COMMAND
root 124910 10.2 0.8 5232084 290952 ? Sl Mar17 220:37 python2 offline.py restart
# ~~~~~~
# 290M 内存占用
解决方法
三个步骤确定问题所在:
· 确认当时程序是否有异常行为;
· 排除行为异常后,查看python内存使用情况,确认所有相关对象的回收情况;
· 排除垃圾回收等python内部内存泄漏问题后,则可以定位到libc的malloc实现问题;
确定后可直接替换malloc模块为tcmalloc:
LD_PRELOAD="/usr/lib64/libtcmalloc.so" python x.py
问题定位过程解读
gdb-python:搞清楚python程序在做什么
首先确定python在做什么,是否有大内存消耗任务正在运行,或出现死锁等异常行为。
从gdb-7开始,gdb支持用python实现gdb扩展,可以像调试c程序一样,用gdb对python程序检查线程、调用栈等;且可同时打印python代码和内部c代码的调用栈。
这对于定位是python代码问题还是其底层c代码问题,有很大帮助。
· 准备gdb
首先安装python的debuginfo:
# debuginfo-install python-2.7.5-39.el7_2.x86_64
如果缺少debuginfo,当运行后续步骤时,gdb会提示,按提示安装完成即可:
Missing separate debuginfos, use: debuginfo-install python-2.7.5-39.el7_2.x86_64
· 接入gdb
可直接用gdb attach到1个python进程,查看其运行状态:
# gdb python 11122
attach之后进入gdb,基本检查步骤如下:
· 查看线程
(gdb) info threads
Id Target Id Frame
206 Thread 0x7febdbfe3700 (LWP 124916) "python2" 0x00007febe9b75413 in select () at ../sysdeps/unix/syscall-template.S:81
205 Thread 0x7febdb7e2700 (LWP 124917) "python2" 0x00007febe9b75413 in select () at ../sysdeps/unix/syscall-template.S:81
204 Thread 0x7febdafe1700 (LWP 124918) "python2" 0x00007febe9b75413 in select () at ../sysdeps/unix/syscall-template.S:81
203 Thread 0x7febda7e0700 (LWP 124919) "python2" 0x00007febe9b7369d in poll () at ../sysdeps/unix/syscall-template.S:81
一般加锁、死锁情况存在时,会有线程卡在xx_wait等函数上。
之前用该方法定位了1个python-logging模块引起的死锁问题:
在多线程进程中运行fork,导致logging的锁被锁住后fork到新进程、但解锁线程没有fork到新进程而导致死锁。
· 查看调用栈
如果发现某线程有问题,切换到此线程上,查看调用栈确定具体执行步骤,使用bt 命令:
(gdb) bt
#16 0x00007febea8500bd in PyEval_EvalCodeEx (co=<optimized out>, globals=<optimized out>, locals=locals@entry=0x0, args=<optimized out>, argcount=argcount@entry=1, kws=0x38aa668, kwcount=2, defs=0x3282a88, defcount=2, closure=closure@entry=0x0) at /usr/src/debug/Python-2.7.5/Python/ceval.c:3330
...
#19 PyEval_EvalFrameEx (f=f@entry=Frame 0x38aa4d0, for file t.py, line 647, in run (part_num=2, consumer=<...
bt 命令不仅可以看到c的调用栈,还会显示python源码的调用栈。 上图中,frame-16是c的调用栈,frame-19显示python源代码的所在行。
如果只查看python代码的调用栈,则使用py-bt命令:
(gdb) py-bt
#1 <built-in method poll of select.epoll object at remote 0x7febeacc5930>
#3 Frame 0x3952450, for file /usr/lib64/python2.7/site-packages/twisted/internet/epollreactor.py, line 379, in doPoll(self=<... l = self._poller.poll(timeout, len(self._selectables))
#7 Frame 0x39502a0, for file /usr/lib64/python2.7/site-packages/twisted/internet/base.py, line 1204, in mainLoop (self=<...
py-bt显示python源码的调用栈、调用参数以及所在行的代码。
· coredump
如果要进行长时间跟踪,最好 coredump下python程序的全部进程信息,之后再分析core文件,避免影响正在运行的程序。
(gdb) generate-core-file
这条命令将当前gdb attach的程序dump到其运行目录,命名为core.<pid>,然后使用gdb 加载该core文件,进行打印堆栈、查看变量等分析,无需attach到正在运行的程序:
# gdb python core.<pid>
· 其他命令
其他命令可以在gdb输入py<TAB><TAB> 查看,与gdb的命令对应,例如:
(gdb) py
py-bt py-list py-print python
py-down py-locals py-up python-interactive
Ø py-up、py-down 可移动到python调用栈的上一个或下一个frame;
Ø py-locals 用来打印局部变量……
gdb中也可用help命令查看帮助:
(gdb) help py-print
Look up the given python variable name, and print it
在这次追踪过程中,用gdb-python排除了程序逻辑问题。接下来继续追踪内存泄漏问题。
pyrasite: 连接进入python程序
pyrasite可以直接连上一个正在运行的python程序,打开一个类似ipython的交互终端来运行命令、检查程序状态。
这为调试提供了极大的方便。
安装:
# pip install pyrasite
...
# pip show pyrasite
Name: pyrasite
Version: 2.0
Summary: Inject code into a running Python process
Home-page: http://pyrasite.com
Author: Luke Macken
...
连接到有问题的python程序,开始收集信息:
pyrasite-shell <pid>
>>>
接下来就可以在<pid>进程里调用任意python代码,查看进程状态。
psutil 查看python进程状态
pip install psutil
首先查看python进程占用的系统内存RSS:
pyrasite-shell 11122
>>> import psutil, os
>>> psutil.Process(os.getpid()).memory_info().rss 29095232
基本与ps命令显示结果一致:
rss the real memory (resident set) size of the process (in 1024 byte units)
guppy 获取内存使用的各种对象占用情况
guppy 可以打印各种对象所占空间大小,如果python进程中有未释放的对象,造成内存占用升高,可通过guppy查看。
同样,以下步骤是通过pyrasite-shell,attach到目标进程后操作的。
# pip install guppy
from guppy import hpy
h = hpy()
h.heap()
# Partition of a set of 48477 objects. Total size = 3265516 bytes.
# Index Count % Size % Cumulative % Kind (class / dict of class)
# 0 25773 53 1612820 49 1612820 49 str
# 1 11699 24 483960 15 2096780 64 tuple
# 2 174 0 241584 7 2338364 72 dict of module
# 3 3478 7 222592 7 2560956 78 types.CodeType
# 4 3296 7 184576 6 2745532 84 function
# 5 401 1 175112 5 2920644 89 dict of class
# 6 108 0 81888 3 3002532 92 dict (no owner)
# 7 114 0 79632 2 3082164 94 dict of type
# 8 117 0 51336 2 3133500 96 type
# 9 667 1 24012 1 3157512 97 __builtin__.wrapper_descriptor
# <76 more rows. Type e.g. '_.more' to view.>
h.iso(1,[],{})
# Partition of a set of 3 objects. Total size = 176 bytes.
# Index Count % Size % Cumulative % Kind (class / dict of class)
# 0 1 33 136 77 136 77 dict (no owner)
# 1 1 33 28 16 164 93 list
# 2 1 33 12 7 176 100 int
通过以上步骤可排除python进程中存在未释放的对象的可能。
无法回收的对象
python本身带有垃圾回收,但同时满足以下2个条件时,python程序中个别对象则无法被回收(uncollectable object) :
Ø 循环引用
Ø 循环引用链上某对象定义了__del__方法
官方解释是:循环引用的一组对象被gc模块识别为可回收,但需先调用每个对象上的__del__才可被回收。当用户自定义了__del__的对象,gc系统无法判断应先调用环上的哪个__del__,因此无法回收这类对象。
不能回收的python对象会持续占据内存,因此,我们推测有不能被回收的对象导致了内存持续升高。
最终确定不是由这种问题引起的内存无法释放。不能回收的对象仍可通过gc.get_objects() 列出,并会在gc.collect()调用后加入gc.garbage的list里。但目前尚未发现这类对象的存在。
查找uncollectable的对象:
pyrasite-shell 11122
>>> import gc
>>> gc.collect() # first run gc, find out uncollectable object and put them in gc.garbage
# output number of object collected
>>> gc.garbage # print all uncollectable objects
[] # empty
如果打印出任何不能回收的对象,则需进一步查找,确定循环引用链上哪个对象包含__del__方法。
下面应用1个例子来演示如何生成不能回收的对象:
from __future__ import print_function
import gc
'''
This snippet shows how to create a uncollectible object:
It is an object in a cycle reference chain, in which there is an object
with __del__ defined.
The simpliest is an object that refers to itself and with a __del__ defined.
> python uncollectible.py
======= collectible object =======
*** init, nr of referrers: 4
garbage: []
created: collectible: <__main__.One object at 0x102c01090>
nr of referrers: 5
delete:
*** __del__ called
*** after gc, nr of referrers: 4
garbage: []
======= uncollectible object =======
*** init, nr of referrers: 4
garbage: []
created: uncollectible: <__main__.One object at 0x102c01110>
nr of referrers: 5
delete:
*** after gc, nr of referrers: 5
garbage: [<__main__.One object at 0x102c01110>]
'''
def dd(*msg):
for m in msg:
print(m, end='')
print()
class One(object):
def __init__(self, collectible):
if collectible:
self.typ = 'collectible'
else:
self.typ = 'uncollectible'
# Make a reference to it self, to form a reference cycle.
# A reference cycle with __del__, makes it uncollectible.
self.me = self
def __del__(self):
dd('*** __del__ called')
def test_it(collectible):
dd()
dd('======= ', ('collectible' if collectible else 'uncollectible'), ' object =======')
dd()
gc.collect()
dd('*** init, nr of referrers: ', len(gc.get_referrers(One)))
dd(' garbage: ', gc.garbage)
one = One(collectible)
dd(' created: ', one.typ, ': ', one)
dd(' nr of referrers: ', len(gc.get_referrers(One)))
dd(' delete:')
del one
gc.collect()
dd('*** after gc, nr of referrers: ', len(gc.get_referrers(One)))
dd(' garbage: ', gc.garbage)
if __name__ == "__main__":
test_it(collectible=True)
test_it(collectible=False)
上面这段代码创建了2个对象:1个可回收、1个不可回收,它们都定义了__del__方法,唯一区别在于是否引用了自己(从而构成了引用环)。
如果在这个步骤发现了循环引用,则需进一步查出具体哪些引用关系造成了循环,进而破坏循环引用,最终让对象可回收。
objgraph 查找循环引用
# pip install objgraph
pyrasite-shell 11122
>>> import objgraph
>>> objgraph.show_refs([an_object], filename='sample-graph.png')
以上例子中,将在本地生成一个图片,描述可以由an_object引用到的关系图:
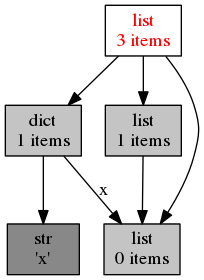
在这一步我们仍未找到不能回收的对象,排除一切原因后我们推测libc的malloc实现问题。使用tcmalloc替代libc默认的malloc后问题最终得到修复。


 2201
2201

 被折叠的 条评论
为什么被折叠?
被折叠的 条评论
为什么被折叠?
 到【灌水乐园】发言


