


10.6 监控io性能(vmstat查看b列或者wa列值大,磁盘有瓶颈,查看磁盘)
iostat -x 磁盘使用
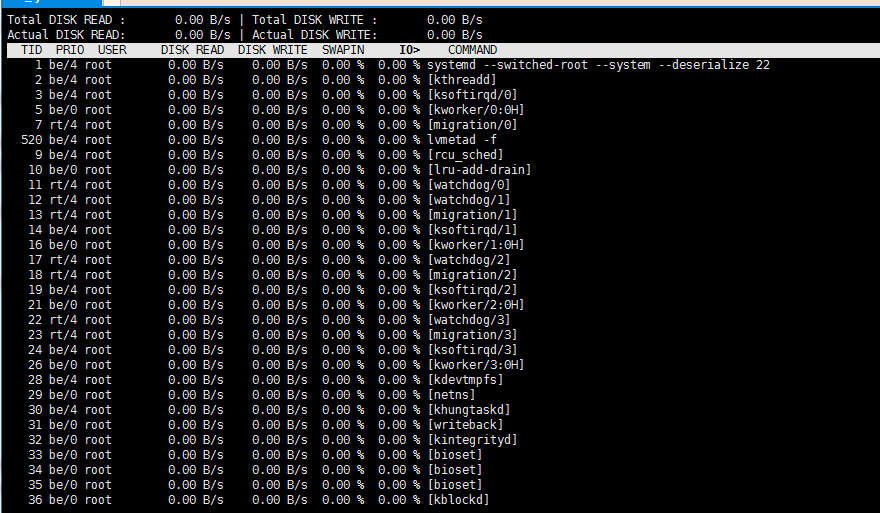
iotop 磁盘使用
安装命令[root
@test ~]# yum install -y sysstat 时会自动安装iostat 与sar命令同一个包
[root
@test ~]# iostat
Linux 3.10.0-862.14.4.el7.x86_64 (test) 2018年10月24日 _x86_64_ (4 CPU)
avg-cpu: %user %nice %system %iowait %steal %idle
0.03 0.00 0.03 0.00 0.00 99.93
Device: tps kB_read/s(读) kB_wrtn/s(写) kB_read kB_wrtn
sda (硬盘) 0.04 0.39 0.39 432007 433199
dm-0 0.04 0.37 0.38 415212 418334
dm-1 0.00 0.00 0.00 2228 0
%util查看io等待
[root@test ~]# iostat -x
Linux 3.10.0-862.14.4.el7.x86_64 (test) 2018年10月24日 _x86_64_ (4 CPU)
avg-cpu: %user %nice %system %iowait %steal %idle
0.03 0.00 0.03 0.00 0.00 99.93
Device: rrqm/s wrqm/s r/s w/s
rkB/s wkB/s avgrq-sz avgqu-sz await r_await w_await svctm
%util(百分比,io等待,磁盘使用多少时间占用cpu)
sda 0.00 0.00 0.01 0.02 0.39 0.39 40.73 0.00 20.88 3.31 30.29 3.77 0.01
dm-0 0.00 0.00 0.01 0.03 0.37 0.38 39.47 0.00 25.73 3.87 35.15 3.51 0.01
dm-1 0.00 0.00 0.00 0.00 0.00 0.00 47.40 0.00 0.59 0.59 0.00 0.38 0.00
注:cpu一部分时间进程处理计算,一部分时间等待磁盘io,等待数据读写,百分之50至60说明磁盘很忙, rkB/s wkB/s磁盘忙碌则这两列会很大,如果不大,%util大说明磁盘有问题
查看哪个进程在读写
安装命令[root
@test ~]# yum install -y iotop
[root
@test ~]# iotop
10.7 free命令
free 查看内存使用情况
free -m / -g / -h
buffer/cache区别
公式:total=used+free+buff/cache
avaliable包含free和buffer/cache剩余部分
[root@test ~]# free
total(总大小 kb) used(使用) free(空闲) shared(共享) buff/cache(预分出来了一部分内存) available(free+buff/cache未用完的总和)
Mem(内存): 3881028 185648 3086944 9052 608436 3431096
Swap(交换分区): 2097148 0 2097148
指定大小单位
[root@test ~]# free -m
total used free shared buff/cache available
Mem: 3790 181 3014 8 594 3350
Swap: 2047 0 2047
[root@test ~]# free -h
total used free shared buff/cache available
Mem: 3.7G 180M 2.9G 8.8M 594M 3.3G
Swap: 2.0G 0B 2.0G
buff缓冲/cache缓存
数据流向:数据从磁盘中读出来让cpu去运算,过度需要经过内存(磁盘的速率和cpu的速率相差很大,中间需要内存去缓和),这部分空间叫做cache缓存
CPU(速率很快无法等待磁盘的速率)计算完的数据存至磁盘,过度需要经过内存,这部分叫做buff(缓冲)
total=used+free+buff/cache
10.8 ps命令
ps - report a snapshot of the current processes. 把当前进程快照汇报
[root@test ~]# ps aux (所有进程情况 静态)
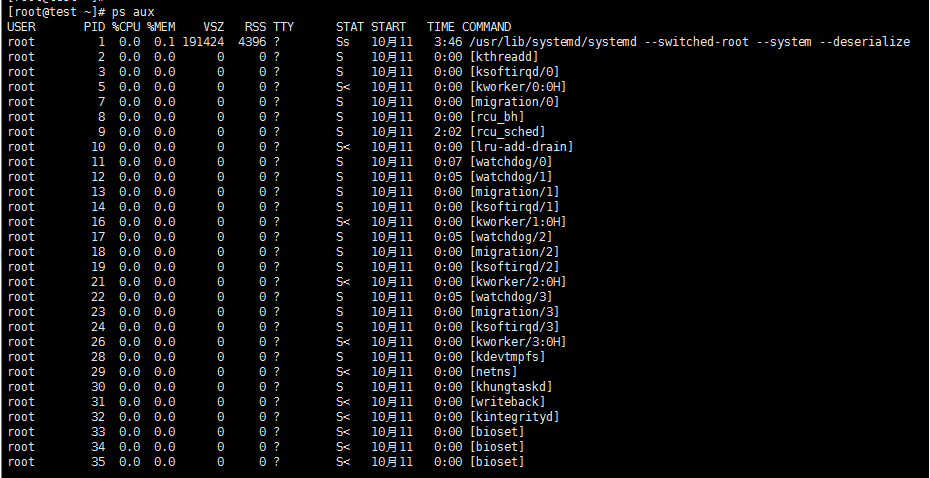
注
第一列进程运行用户
第二列 PID 进程ID 杀死进程 kill PID kill -9 PID
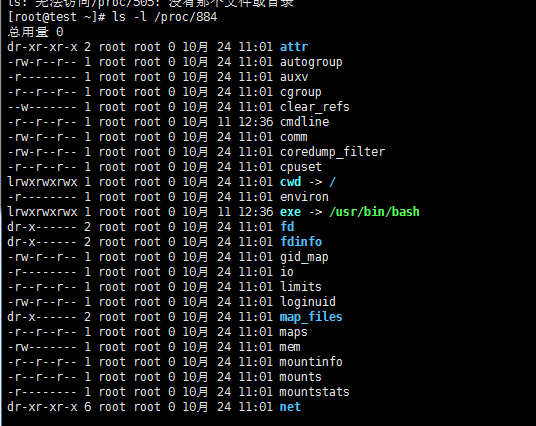
未知的进程查看进程位置
[root@test ~]# ls -l /proc/884(PID)
第三列CPU百分比
第四列内存百分比
第五列虚拟内存
第六列物理内存
第七列在哪个终端上
第八列需要关注进程状态
STAT部分说明
D 不能中断的进程 (影响系统负载)

R run状态的进程
S sleep状态的进程

T 暂停的进程
Z 僵尸进程 (僵尸进程必须杀死)
< 高优先级进程 (所有进程都要让这些进程先用cpu)
N 低优先级进程 (进程不急)
L 内存中被锁了内存分页
s 主进程
Nginx Ss为父进程 下面www都是子进程(master派生出来)

l 多线程进程 (一个进程中有多个线程,并且涉及内存使用 1 进程里包含了线程,线程是进程的子单元 2 同一个进程下的线程全部共享相同的内存,而进程之间内存相互隔离。)
+ 前台进程
第九列启动时间
第十列运行多久
第十一列命令及路径
[root@test ~]# ps aux |grep nginx
root 11240 0.0 0.0 112720 976 pts/0 S+ 10:56 0:00 grep --color=auto nginx
[root@test ~]# ps aux |grep sshd
root 1142 0.0 0.1 112812 4332 ? Ss 10月11 0:00 /usr/sbin/sshd -D
root 10673 0.0 0.1 159356 6024 ? Ss 10:02 0:00 sshd: root@pts/0
root 11242 0.0 0.0 112720 976 pts/0 S+ 10:56 0:00 grep --color=auto sshd
[root@test ~]# ps -elf

10.9 查看网络状态
监听端口(一台服务器无任何端口监听,无端口无法与外界通信)
root@test ~]# netstat -lnp l监听
[root@test ~]# netstat -ltunp只查看tcp和udp
master发邮件端口25
unix socket文件通信使用 进程与进程之间通信
查看TCP -IP状态 所有连接状态(tcp三次握手四次挥手 扩展)
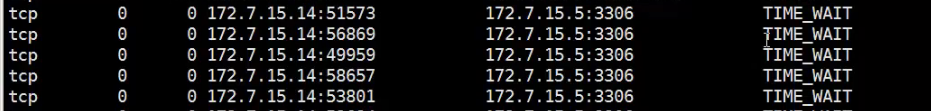
[root@test ~]# netstat -an
客户端和服务端通信完后连接没有断开处于相互等待,等待再次连接 TIME_WAIT
查看所有状态统计
[root@test ~]# netstat -an | awk '/^tcp/ {++sta[$NF]} END {for(key in sta) print key,"\t",sta[key]}'
LISTEN 9
ESTABLISHED 1
ESTABLISHED数字很大说明系统很忙,网站并发连接数,表示同一时间有多少客户端在连接服务端通信(通常1000以内)
另一种命令
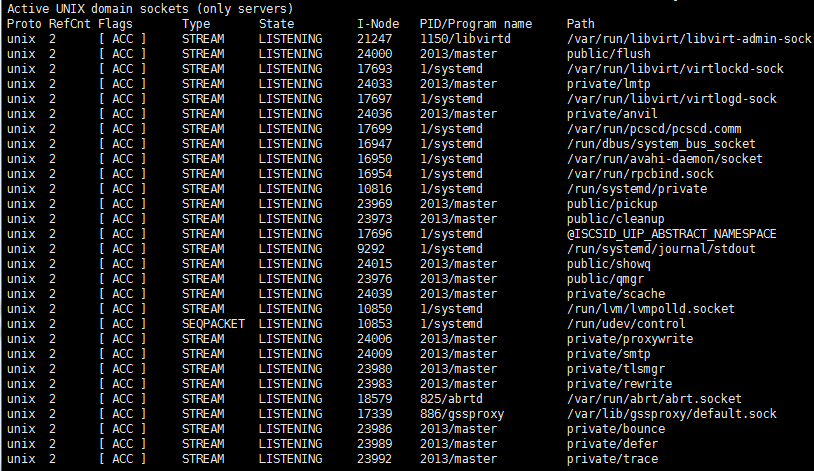
[root@test ~]# ss -an |grep -i listen
u_str LISTEN 0 20 /var/run/libvirt/libvirt-admin-sock 21247 * 0
u_str LISTEN 0 100 public/flush 24000 * 0
u_str LISTEN 0 128 /var/run/libvirt/virtlockd-sock 17693 * 0
u_str LISTEN 0 100 private/lmtp 24033 * 0
u_str LISTEN 0 128 /var/run/libvirt/virtlogd-sock 17697 * 0
u_str LISTEN 0 100 private/anvil 24036 * 0
10.10 linux下抓包
安装命令[root@test ~]# yum install -y tcpdump
指定网卡
[root@test ~]# tcpdump -nn -i ens32 (-nn n第一个IP用数字显示 不加n则用主机名显示 n表示端口号)(查看数据流向)

第一列时间 第二列是源IP.端口号 >(方向)第三列目标IP.端口 后面是数据包信息
数据包有来回,一对出现
udtp的包有可能被攻击 DDos攻击 udp flood
指定端口
[root@test ~]# tcpdump -nn -i ens32 port 80
显示除某个端口的包
[root@test ~]# tcpdump -nn -i ens32 not port 80
显示指定端口和包名
[root@test ~]# tcpdump -nn -i ens32 port 80 and host 115.236.28.52
写入脚本中指定包数-c指定抓包数量 -w写入到指定文件 (1.cap是捕获真正的网卡数据)
[root@test ~]# tcpdump -nn -i ens32 not port 80 and host 115.236.28.52 -c 100 -w /tmp/1.cap
[root@test ~]# tcpdump -nn -i ens32 -c 100 -w /tmp/1.cap
tcpdump: listening on ens32, link-type EN10MB (Ethernet), capture size 262144 bytes
100 packets captured
100 packets received by filter
0 packets dropped by kernel
查看文件内容
[root@test ~]# tcpdump -r /tmp/1.cap
tshark抓包
命令安装
[root@test ~]# yum install -y wireshark
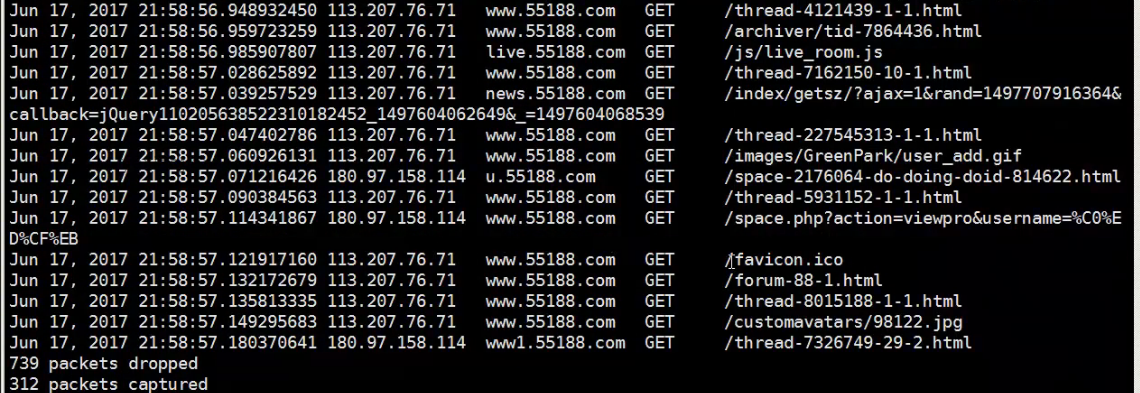
指定网卡80端口web访问情况(类似网站访问日志)
[root@test ~]# tshark -n -t a -R http.request -T fields -e "frame.time" -e "ip.src" -e "http.host" -e "http.request.method" -e "http.request.uri"


 1567
1567

 被折叠的 条评论
为什么被折叠?
被折叠的 条评论
为什么被折叠?
 到【灌水乐园】发言


