D3 arc

https://github.com/d3/d3/blob/master/API.md#arcs
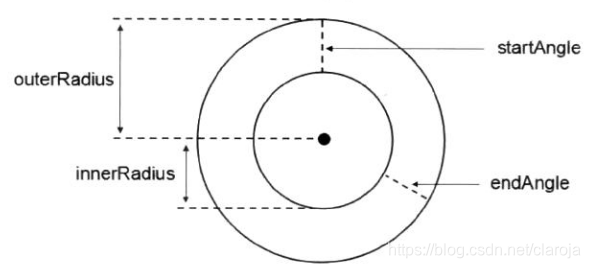
innerRadius() 内半径
outerRadius() 外半径
startAngle()起始角度
endAngle()终止角度

在这里插入图片描述

    <script>
        svg = d3.select('body')
            .append('svg')
            .attr("width",300)
            .attr('height',300)
        var dataset = {startAngle:0,endAngle:Math.PI*0.5}
        var arcPath = d3.svg.arc()
                        .innerRadius(50)
                        .outerRadius(100)

        svg.append('path')
            .attr('d',arcPath(dataset))
            .attr('stroke','black')
            .attr('stroke-width','3px')
            .attr('fill','none')
            .attr('transform',"translate(150,150)")//移动圆心
    </script>

饼图就是内径为0,连续的几个弧度

d3.arc - create a new arc generator.
arc - generate an arc for the given datum.
arc.centroid - compute an arc’s midpoint.
arc.innerRadius - set the inner radius.
arc.outerRadius - set the outer radius.
arc.cornerRadius - set the corner radius, for rounded corners.
arc.startAngle - set the start angle.
arc.endAngle - set the end angle.
arc.padAngle - set the angle between adjacent arcs, for padded arcs.
arc.padRadius - set the radius at which to linearize padding.
arc.context - set the rendering context.

  • 1
    点赞
  • 0
    收藏
    觉得还不错? 一键收藏
  • 0
    评论
使用d3.js制作饼状图可以分为以下步骤: 1. 准备数据:需要准备一个包含每个部分所占比例的数据集。 2. 创建 SVG 元素:使用 d3.select() 和 append() 方法创建 SVG 元素。 3. 设置饼图参数:使用 d3.pie() 方法设置饼图参数,例如排序方式、起始角度、结束角度等。 4. 绘制饼图:使用 d3.arc() 方法绘制每个部分的路径,并使用 d3.select() 和 append() 方法创建 path 元素。 5. 添加标签:使用 d3.text() 方法添加标签,例如图例、标题等。 6. 添加交互:使用 d3.mouseover() 和 d3.mouseout() 方法为饼图添加鼠标事件。 以下是一个基本的饼状图代码示例: ```javascript // 准备数据 var dataset = [30, 10, 20, 40]; // 创建 SVG 元素 var svg = d3.select("body") .append("svg") .attr("width", 400) .attr("height", 400); // 设置饼图参数 var pie = d3.pie() .sort(null) .value(function(d) { return d; }); // 绘制饼图 var arc = d3.arc() .innerRadius(0) .outerRadius(150); var arcs = svg.selectAll("g.arc") .data(pie(dataset)) .enter() .append("g") .attr("class", "arc") .attr("transform", "translate(200,200)"); arcs.append("path") .attr("d", arc) .attr("fill", function(d, i) { return d3.schemeCategory10[i]; }); // 添加标签 svg.append("text") .attr("x", 180) .attr("y", 20) .attr("text-anchor", "middle") .attr("font-size", "20px") .text("饼状图"); // 添加交互 arcs.on("mouseover", function(d) { d3.select(this) .select("path") .attr("stroke", "#fff") .attr("stroke-width", 2); }) .on("mouseout", function(d) { d3.select(this) .select("path") .attr("stroke", "none"); }); ``` 在这个示例中,我们准备了一个包含四个部分的数据集,创建了一个 SVG 元素,设置了饼图参数,绘制了每个部分的路径,并添加了标签和交互。你可以根据自己的需求对代码进行修改和扩展。

“相关推荐”对你有帮助么?

  • 非常没帮助
  • 没帮助
  • 一般
  • 有帮助
  • 非常有帮助
提交
评论
添加红包

请填写红包祝福语或标题

红包个数最小为10个

红包金额最低5元

当前余额3.43前往充值 >
需支付:10.00
成就一亿技术人!
领取后你会自动成为博主和红包主的粉丝 规则
hope_wisdom
发出的红包
实付
使用余额支付
点击重新获取
扫码支付
钱包余额 0

抵扣说明:

1.余额是钱包充值的虚拟货币,按照1:1的比例进行支付金额的抵扣。
2.余额无法直接购买下载,可以购买VIP、付费专栏及课程。

余额充值