


Have you ever wondered how system calls can be intercepted? Have you ever tried fooling the kernel by changing system call arguments? Have you ever wondered how debuggers stop a running process and let you take control of the process?
If you are thinking of using complex kernel programming to accomplish tasks, think again. Linux provides an elegant mechanism to achieve all of these things: the ptrace (Process Trace) system call. ptrace provides a mechanism by which a parent process may observe and control the execution of another process. It can examine and change its core image and registers and is used primarily to implement breakpoint debugging and system call tracing.
In this article, we learn how to intercept a system call and change its arguments. In Part II of the article we will study advanced techniques—setting breakpoints and injecting code into a running program. We will peek into the child process' registers and data segment and modify the contents. We will also describe a way to inject code so the process can be stopped and execute arbitrary instructions.
Operating systems offer services through a standard mechanism called system calls. They provide a standard API for accessing the underlying hardware and low-level services, such as the filesystems. When a process wants to invoke a system call, it puts the arguments to system calls in registers and calls soft interrupt 0x80. This soft interrupt is like a gate to the kernel mode, and the kernel will execute the system call after examining the arguments.
On the i386 architecture (all the code in this article is i386-specific), the system call number is put in the register %eax. The arguments to this system call are put into registers %ebx, %ecx, %edx, %esi and %edi, in that order. For example, the call:
write(2, "Hello", 5)
roughly would translate into
movl   $4, %eax
movl   $2, %ebx
movl   $hello,%ecx
movl   $5, %edx
int    $0x80
where $hello points to a literal string “Hello”.
So where does ptrace come into picture? Before executing the system call, the kernel checks whether the process is being traced. If it is, the kernel stops the process and gives control to the tracking process so it can examine and modify the traced process' registers.
Let's clarify this explanation with an example of how the process works:
#include <sys/ptrace.h>
#include <sys/types.h>
#include <sys/wait.h>
#include <unistd.h>
#include <linux/user.h>   /* For constants
                                   ORIG_EAX etc */
int main()
{   pid_t child;
    long orig_eax;
    child = fork();
    if(child == 0) {
        ptrace(PTRACE_TRACEME, 0, NULL, NULL);
        execl("/bin/ls", "ls", NULL);
    }
    else {
        wait(NULL);
        orig_eax = ptrace(PTRACE_PEEKUSER,
                          child, 4 * ORIG_EAX,
                          NULL);
        printf("The child made a "
               "system call %ld/n", orig_eax);
        ptrace(PTRACE_CONT, child, NULL, NULL);
    }
    return 0;
}
When run, this program prints:
The child made a system call 11along with the output of ls. System call number 11 is execve, and it's the first system call executed by the child. For reference, system call numbers can be found in /usr/include/asm/unistd.h.
As you can see in the example, a process forks a child and the child executes the process we want to trace. Before running exec , the child calls ptrace with the first argument, equal to PTRACE_TRACEME. This tells the kernel that the process is being traced, and when the child executes the execve system call, it hands over control to its parent. The parent waits for notification from the kernel with a wait() call. Then the parent can check the arguments of the system call or do other things, such as looking into the registers.
When the system call occurs, the kernel saves the original contents of the eax register, which contains the system call number. We can read this value from child's USER segment by calling ptrace with the first argument PTRACE_PEEKUSER, shown as above.
After we are done examining the system call, the child can continue with a call to ptrace with the first argument PTRACE_CONT, which lets the system call continue.
ptrace is called with four arguments:
long ptrace(enum __ptrace_request request,
            pid_t pid,
            void *addr,
            void *data);
The first argument determines the behaviour of ptrace and how other arguments are used. The value of request should be one of PTRACE_TRACEME, PTRACE_PEEKTEXT, PTRACE_PEEKDATA, PTRACE_PEEKUSER, PTRACE_POKETEXT, PTRACE_POKEDATA, PTRACE_POKEUSER, PTRACE_GETREGS, PTRACE_GETFPREGS, PTRACE_SETREGS, PTRACE_SETFPREGS, PTRACE_CONT, PTRACE_SYSCALL, PTRACE_SINGLESTEP, PTRACE_DETACH. The significance of each of these requests will be explained in the rest of the article.
By calling ptrace with PTRACE_PEEKUSER as the first argument, we can examine the contents of the USER area where register contents and other information is stored. The kernel stores the contents of registers in this area for the parent process to examine through ptrace.
Let's show this with an example:
#include <sys/ptrace.h>
#include <sys/types.h>
#include <sys/wait.h>
#include <unistd.h>
#include <linux/user.h>
#include <sys/syscall.h>   /* For SYS_write etc */
int main()
{   pid_t child;
    long orig_eax, eax;
    long params[3];
    int status;
    int insyscall = 0;
    child = fork();
    if(child == 0) {
        ptrace(PTRACE_TRACEME, 0, NULL, NULL);
        execl("/bin/ls", "ls", NULL);
    }
    else {
       while(1) {
          wait(&status);
          if(WIFEXITED(status))
              break;
          orig_eax = ptrace(PTRACE_PEEKUSER,
                     child, 4 * ORIG_EAX, NULL);
          if(orig_eax == SYS_write) {
             if(insyscall == 0) {
                /* Syscall entry */
                insyscall = 1;
                params[0] = ptrace(PTRACE_PEEKUSER,
                                   child, 4 * EBX,
                                   NULL);
                params[1] = ptrace(PTRACE_PEEKUSER,
                                   child, 4 * ECX,
                                   NULL);
                params[2] = ptrace(PTRACE_PEEKUSER,
                                   child, 4 * EDX,
                                   NULL);
                printf("Write called with "
                       "%ld, %ld, %ld/n",
                       params[0], params[1],
                       params[2]);
                }
          else { /* Syscall exit */
                eax = ptrace(PTRACE_PEEKUSER,
                             child, 4 * EAX, NULL);
                    printf("Write returned "
                           "with %ld/n", eax);
                    insyscall = 0;
                }
            }
            ptrace(PTRACE_SYSCALL,
                   child, NULL, NULL);
        }
    }
    return 0;
}
This program should print an output similar to the following:
ppadala@linux:~/ptrace > ls
a.out        dummy.s      ptrace.txt
libgpm.html  registers.c  syscallparams.c
dummy        ptrace.html  simple.c
ppadala@linux:~/ptrace > ./a.out
Write called with 1, 1075154944, 48
a.out        dummy.s      ptrace.txt
Write returned with 48
Write called with 1, 1075154944, 59
libgpm.html  registers.c  syscallparams.c
Write returned with 59
Write called with 1, 1075154944, 30
dummy        ptrace.html  simple.c
Write returned with 30
Here we are tracing the write system calls, and ls makes three write system calls. The call to ptrace, with a first argument of PTRACE_SYSCALL, makes the kernel stop the child process whenever a system call entry or exit is made. It's equivalent to doing a PTRACE_CONT and stopping at the next system call entry/exit.
In the previous example, we used PTRACE_PEEKUSER to look into the arguments of the write system call. When a system call returns, the return value is placed in %eax, and it can be read as shown in that example.
The status variable in the wait call is used to check whether the child has exited. This is the typical way to check whether the child has been stopped by ptrace or was able to exit. For more details on macros like WIFEXITED, see the wait(2) man page.
If you want to read register values at the time of a syscall entry or exit, the procedure shown above can be cumbersome. Calling ptrace with a first argument of PTRACE_GETREGS will place all the registers in a single call.
The code to fetch register values looks like this:
#include <sys/ptrace.h>
#include <sys/types.h>
#include <sys/wait.h>
#include <unistd.h>
#include <linux/user.h>
#include <sys/syscall.h>
int main()
{ pid_t child;
long orig_eax, eax;
long params[3];
int status;
int insyscall = 0;
struct user_regs_struct regs;
child = fork();
if(child == 0) {
ptrace(PTRACE_TRACEME, 0, NULL, NULL);
execl("/bin/ls", "ls", NULL);
}
else {
while(1) {
wait(&status);
if(WIFEXITED(status))
break;
orig_eax = ptrace(PTRACE_PEEKUSER,
child, 4 * ORIG_EAX,
NULL);
if(orig_eax == SYS_write) {
if(insyscall == 0) {
/* Syscall entry */
insyscall = 1;
ptrace(PTRACE_GETREGS, child,
NULL, ®s);
printf("Write called with "
"%ld, %ld, %ld/n",
regs.ebx, regs.ecx,
regs.edx);
}
else { /* Syscall exit */
eax = ptrace(PTRACE_PEEKUSER,
child, 4 * EAX,
NULL);
printf("Write returned "
"with %ld/n", eax);
insyscall = 0;
}
}
ptrace(PTRACE_SYSCALL, child,
NULL, NULL);
}
}
return 0;
}
This code is similar to the previous example except for the call to ptrace with PTRACE_GETREGS. Here we have made use of the user_regs_struct defined in <linux/user.h> to read the register values.
Now it's time for some fun. In the following example, we will reverse the string passed to the write system call:
#include <sys/ptrace.h>
#include <sys/types.h>
#include <sys/wait.h>
#include <unistd.h>
#include <linux/user.h>
#include <sys/syscall.h>
const int long_size = sizeof(long);
void reverse(char *str)
{   int i, j;
    char temp;
    for(i = 0, j = strlen(str) - 2;
        i <= j; ++i, --j) {
        temp = str[i];
        str[i] = str[j];
        str[j] = temp;
    }
}
void getdata(pid_t child, long addr,
             char *str, int len)
{   char *laddr;
    int i, j;
    union u {
            long val;
            char chars[long_size];
    }data;
    i = 0;
    j = len / long_size;
    laddr = str;
    while(i < j) {
        data.val = ptrace(PTRACE_PEEKDATA,
                          child, addr + i * 4,
                          NULL);
        memcpy(laddr, data.chars, long_size);
        ++i;
        laddr += long_size;
    }
    j = len % long_size;
    if(j != 0) {
        data.val = ptrace(PTRACE_PEEKDATA,
                          child, addr + i * 4,
                          NULL);
        memcpy(laddr, data.chars, j);
    }
    str[len] = '/0';
}
void putdata(pid_t child, long addr,
             char *str, int len)
{   char *laddr;
    int i, j;
    union u {
            long val;
            char chars[long_size];
    }data;
    i = 0;
    j = len / long_size;
    laddr = str;
    while(i < j) {
        memcpy(data.chars, laddr, long_size);
        ptrace(PTRACE_POKEDATA, child,
               addr + i * 4, data.val);
        ++i;
        laddr += long_size;
    }
    j = len % long_size;
    if(j != 0) {
        memcpy(data.chars, laddr, j);
        ptrace(PTRACE_POKEDATA, child,
               addr + i * 4, data.val);
    }
}
int main()
{
   pid_t child;
   child = fork();
   if(child == 0) {
      ptrace(PTRACE_TRACEME, 0, NULL, NULL);
      execl("/bin/ls", "ls", NULL);
   }
   else {
      long orig_eax;
      long params[3];
      int status;
      char *str, *laddr;
      int toggle = 0;
      while(1) {
         wait(&status);
         if(WIFEXITED(status))
             break;
         orig_eax = ptrace(PTRACE_PEEKUSER,
                           child, 4 * ORIG_EAX,
                           NULL);
         if(orig_eax == SYS_write) {
            if(toggle == 0) {
               toggle = 1;
               params[0] = ptrace(PTRACE_PEEKUSER,
                                  child, 4 * EBX,
                                  NULL);
               params[1] = ptrace(PTRACE_PEEKUSER,
                                  child, 4 * ECX,
                                  NULL);
               params[2] = ptrace(PTRACE_PEEKUSER,
                                  child, 4 * EDX,
                                  NULL);
               str = (char *)calloc((params[2]+1)
                                 * sizeof(char));
               getdata(child, params[1], str,
                       params[2]);
               reverse(str);
               putdata(child, params[1], str,
                       params[2]);
            }
            else {
               toggle = 0;
            }
         }
      ptrace(PTRACE_SYSCALL, child, NULL, NULL);
      }
   }
   return 0;
}
The output looks like this:
ppadala@linux:~/ptrace > ls
a.out        dummy.s      ptrace.txt
libgpm.html  registers.c  syscallparams.c
dummy        ptrace.html  simple.c
ppadala@linux:~/ptrace > ./a.out
txt.ecartp      s.ymmud      tuo.a
c.sretsiger     lmth.mpgbil  c.llacys_egnahc
c.elpmis        lmth.ecartp  ymmud
This example makes use of all the concepts previously discussed, plus a few more. In it, we use calls to ptrace with PTRACE_POKEDATA to change the data values. It works exactly the same way as PTRACE_PEEKDATA, except it both reads and writes the data thatt the child passes in arguments to the system call whereas PEEKDATA only reads the data.
ptrace provides features to single-step through the child's code. The call to ptrace(PTRACE_SINGLESTEP,..) tells the kernel to stop the child at each instruction and let the parent take control. The following example shows a way of reading the instruction being executed when a system call is executed. I have created a small dummy executable for you to understand what is happening instead of bothering with the calls made by libc.
Here's the listing for dummy1.s. It's written in assembly language and compiled as gcc -o dummy1 dummy1.s:
.data
hello:
    .string "hello world/n"
.globl  main
main:
    movl    $4, %eax
    movl    $2, %ebx
    movl    $hello, %ecx
    movl    $12, %edx
    int     $0x80
    movl    $1, %eax
    xorl    %ebx, %ebx
    int     $0x80
    ret
The example program that single-steps through the above code is:
#include <sys/ptrace.h>
#include <sys/types.h>
#include <sys/wait.h>
#include <unistd.h>
#include <linux/user.h>
#include <sys/syscall.h>
int main()
{ pid_t child;
const int long_size = sizeof(long);
child = fork();
if(child == 0) {
ptrace(PTRACE_TRACEME, 0, NULL, NULL);
execl("./dummy1", "dummy1", NULL);
}
else {
int status;
union u {
long val;
char chars[long_size];
}data;
struct user_regs_struct regs;
int start = 0;
long ins;
while(1) {
wait(&status);
if(WIFEXITED(status))
break;
ptrace(PTRACE_GETREGS,
child, NULL, ®s);
if(start == 1) {
ins = ptrace(PTRACE_PEEKTEXT,
child, regs.eip,
NULL);
printf("EIP: %lx Instruction "
"executed: %lx/n",
regs.eip, ins);
}
if(regs.orig_eax == SYS_write) {
start = 1;
ptrace(PTRACE_SINGLESTEP, child,
NULL, NULL);
}
else
ptrace(PTRACE_SYSCALL, child,
NULL, NULL);
}
}
return 0;
}
This program prints:
hello world
EIP: 8049478 Instruction executed: 80cddb31
EIP: 804947c Instruction executed: c3
You might have to look at Intel's manuals to make sense out of those instruction bytes. Using single stepping for more complex processes, such as setting breakpoints, requires careful design and more complex code.
In Part I of this article [LJ , November 2002], we saw how ptrace can be used to trace system calls and change system call arguments. In this article, we investigate advanced techniques like setting breakpoints and injecting code into running programs. Debuggers use these methods to set up breakpoints and execute debugging handlers. As with Part I, all code in this article is i386 architecture-specific.
In Part I, we ran the process to be traced as a child after calling ptrace(PTRACE_TRACEME, ..). If you simply wanted to see how the process is making system calls and trace the program, this would be sufficient. If you want to trace or debug a process already running, then ptrace(PTRACE_ATTACH, ..) should be used.
When a ptrace(PTRACE_ATTACH, ..) is called with the pid to be traced, it is roughly equivalent to the process calling ptrace(PTRACE_TRACEME, ..) and becoming a child of the tracing process. The traced process is sent a SIGSTOP, so we can examine and modify the process as usual. After we are done with modifications or tracing, we can let the traced process continue on its own by calling ptrace(PTRACE_DETACH, ..).
The following is the code for a small example tracing program:
int main()
{   int i;
    for(i = 0;i < 10; ++i) {
        printf("My counter: %d/n", i);
        sleep(2);
    }
    return 0;
}
Save the program as dummy2.c. Compile and run it:
gcc -o dummy2 dummy2.c
./dummy2 &
Now, we can attach to dummy2 by using the code below:
#include <sys/ptrace.h>
#include <sys/types.h>
#include <sys/wait.h>
#include <unistd.h>
#include <linux/user.h> /* For user_regs_struct
etc. */
int main(int argc, char *argv[])
{ pid_t traced_process;
struct user_regs_struct regs;
long ins;
if(argc != 2) {
printf("Usage: %s <pid to be traced>/n",
argv[0], argv[1]);
exit(1);
}
traced_process = atoi(argv[1]);
ptrace(PTRACE_ATTACH, traced_process,
NULL, NULL);
wait(NULL);
ptrace(PTRACE_GETREGS, traced_process,
NULL, ®s);
ins = ptrace(PTRACE_PEEKTEXT, traced_process,
regs.eip, NULL);
printf("EIP: %lx Instruction executed: %lx/n",
regs.eip, ins);
ptrace(PTRACE_DETACH, traced_process,
NULL, NULL);
return 0;
}
The above program simply attaches to a process, waits for it to stop, examines its eip (instruction pointer) and detaches.
To inject code use ptrace(PTRACE_POKETEXT, ..) and ptrace(PTRACE_POKEDATA, ..) after the traced process has stopped.
How do debuggers set breakpoints? Generally, they replace the instruction to be executed with a trap instruction, so that when the traced program stops, the tracing program, the debugger, can examine it. It will replace the original instruction once the tracing program continues the traced process. Here's an example:
#include <sys/ptrace.h>
#include <sys/types.h>
#include <sys/wait.h>
#include <unistd.h>
#include <linux/user.h>
const int long_size = sizeof(long);
void getdata(pid_t child, long addr,
char *str, int len)
{ char *laddr;
int i, j;
union u {
long val;
char chars[long_size];
}data;
i = 0;
j = len / long_size;
laddr = str;
while(i < j) {
data.val = ptrace(PTRACE_PEEKDATA, child,
addr + i * 4, NULL);
memcpy(laddr, data.chars, long_size);
++i;
laddr += long_size;
}
j = len % long_size;
if(j != 0) {
data.val = ptrace(PTRACE_PEEKDATA, child,
addr + i * 4, NULL);
memcpy(laddr, data.chars, j);
}
str[len] = '/0';
}
void putdata(pid_t child, long addr,
char *str, int len)
{ char *laddr;
int i, j;
union u {
long val;
char chars[long_size];
}data;
i = 0;
j = len / long_size;
laddr = str;
while(i < j) {
memcpy(data.chars, laddr, long_size);
ptrace(PTRACE_POKEDATA, child,
addr + i * 4, data.val);
++i;
laddr += long_size;
}
j = len % long_size;
if(j != 0) {
memcpy(data.chars, laddr, j);
ptrace(PTRACE_POKEDATA, child,
addr + i * 4, data.val);
}
}
int main(int argc, char *argv[])
{ pid_t traced_process;
struct user_regs_struct regs, newregs;
long ins;
/* int 0x80, int3 */
char code[] = {0xcd,0x80,0xcc,0};
char backup[4];
if(argc != 2) {
printf("Usage: %s <pid to be traced>/n",
argv[0], argv[1]);
exit(1);
}
traced_process = atoi(argv[1]);
ptrace(PTRACE_ATTACH, traced_process,
NULL, NULL);
wait(NULL);
ptrace(PTRACE_GETREGS, traced_process,
NULL, ®s);
/* Copy instructions into a backup variable */
getdata(traced_process, regs.eip, backup, 3);
/* Put the breakpoint */
putdata(traced_process, regs.eip, code, 3);
/* Let the process continue and execute
the int 3 instruction */
ptrace(PTRACE_CONT, traced_process, NULL, NULL);
wait(NULL);
printf("The process stopped, putting back "
"the original instructions/n");
printf("Press <enter> to continue/n");
getchar();
putdata(traced_process, regs.eip, backup, 3);
/* Setting the eip back to the original
instruction to let the process continue */
ptrace(PTRACE_SETREGS, traced_process,
NULL, ®s);
ptrace(PTRACE_DETACH, traced_process,
NULL, NULL);
return 0;
}
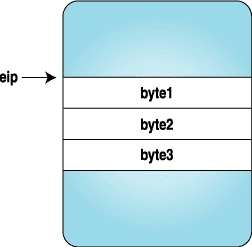
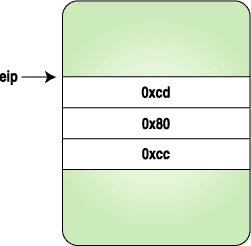
Here we replace the three bytes with the code for a trap instruction, and when the process stops, we replace the original instructions and reset the eip to original location. Figures 1-4 clarify how the instruction stream looks when above program is executed.
|
|
|
| Figure 1. After the Process Is Stopped | Figure 2. After the Trap Instruction Bytes Are Set |
|
|
|
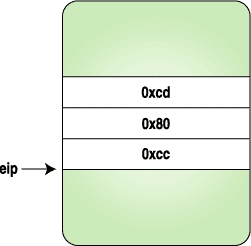
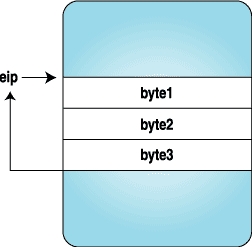
| Figure 3. Trap Is Hit and Control Is Given to the Tracing Program | Figure 4. After the Original Instructions Are Replaced and eip Is Reset to the Original Location |
Now that we have a clear idea of how breakpoints are set, let's inject some code bytes into a running program. These code bytes will print “hello world”.
The following program is a simple “hello world” program with modifications to fit our needs. Compile the following program with:
gcc -o hello hello.c
void main()
{
__asm__("
         jmp forward
backward:
         popl   %esi      # Get the address of
                          # hello world string
         movl   $4, %eax  # Do write system call
         movl   $2, %ebx
         movl   %esi, %ecx
         movl   $12, %edx
         int    $0x80
         int3             # Breakpoint. Here the
                          # program will stop and
                          # give control back to
                          # the parent
forward:
         call   backward
         .string /"Hello World//n/""
       );
}
The jumping backward and forward here is required to find the address of the “hello world” string.
We can get the machine code for the above assembly from GDB. Fire up GDB and disassemble the program:
(gdb) disassemble main
Dump of assembler code for function main:
0x80483e0 <main>:       push   %ebp
0x80483e1 <main+1>:     mov    %esp,%ebp
0x80483e3 <main+3>:     jmp    0x80483fa <forward>
End of assembler dump.
(gdb) disassemble forward
Dump of assembler code for function forward:
0x80483fa <forward>:    call   0x80483e5 <backward>
0x80483ff <forward+5>:  dec    %eax
0x8048400 <forward+6>:  gs
0x8048401 <forward+7>:  insb   (%dx),%es:(%edi)
0x8048402 <forward+8>:  insb   (%dx),%es:(%edi)
0x8048403 <forward+9>:  outsl  %ds:(%esi),(%dx)
0x8048404 <forward+10>: and    %dl,0x6f(%edi)
0x8048407 <forward+13>: jb     0x8048475
0x8048409 <forward+15>: or     %fs:(%eax),%al
0x804840c <forward+18>: mov    %ebp,%esp
0x804840e <forward+20>: pop    %ebp
0x804840f <forward+21>: ret
End of assembler dump.
(gdb) disassemble backward
Dump of assembler code for function backward:
0x80483e5 <backward>:   pop    %esi
0x80483e6 <backward+1>: mov    $0x4,%eax
0x80483eb <backward+6>: mov    $0x2,%ebx
0x80483f0 <backward+11>:        mov    %esi,%ecx
0x80483f2 <backward+13>:        mov    $0xc,%edx
0x80483f7 <backward+18>:        int    $0x80
0x80483f9 <backward+20>:        int3
End of assembler dump.
We need to take the machine code bytes from main+3 to backward+20, which is a total of 41 bytes. The machine code can be seen with the x command in GDB:
(gdb) x/40bx main+3
<main+3>: eb 15 5e b8 04 00 00 00
<backward+6>: bb 02 00 00 00 89 f1 ba
<backward+14>: 0c 00 00 00 cd 80 cc
<forward+1>: e6 ff ff ff 48 65 6c 6c
<forward+9>: 6f 20 57 6f 72 6c 64 0a
Now we have the instruction bytes to be executed. Why wait? We can inject them using the same method as in the previous example. The following is the source code; only the main function is given here:
int main(int argc, char *argv[])
{ pid_t traced_process;
struct user_regs_struct regs, newregs;
long ins;
int len = 41;
char insertcode[] =
"/xeb/x15/x5e/xb8/x04/x00"
"/x00/x00/xbb/x02/x00/x00/x00/x89/xf1/xba"
"/x0c/x00/x00/x00/xcd/x80/xcc/xe8/xe6/xff"
"/xff/xff/x48/x65/x6c/x6c/x6f/x20/x57/x6f"
"/x72/x6c/x64/x0a/x00";
char backup[len];
if(argc != 2) {
printf("Usage: %s <pid to be traced>/n",
argv[0], argv[1]);
exit(1);
}
traced_process = atoi(argv[1]);
ptrace(PTRACE_ATTACH, traced_process,
NULL, NULL);
wait(NULL);
ptrace(PTRACE_GETREGS, traced_process,
NULL, ®s);
getdata(traced_process, regs.eip, backup, len);
putdata(traced_process, regs.eip,
insertcode, len);
ptrace(PTRACE_SETREGS, traced_process,
NULL, ®s);
ptrace(PTRACE_CONT, traced_process,
NULL, NULL);
wait(NULL);
printf("The process stopped, Putting back "
"the original instructions/n");
putdata(traced_process, regs.eip, backup, len);
ptrace(PTRACE_SETREGS, traced_process,
NULL, ®s);
printf("Letting it continue with "
"original flow/n");
ptrace(PTRACE_DETACH, traced_process,
NULL, NULL);
return 0;
}
In the previous example we injected the code directly into the executing instruction stream. However, debuggers can get confused with this kind of behaviour, so let's find the free space in the process and inject the code there. We can find free space by examining the /proc/pid/maps file of the traced process. The following function will find the starting address of this map:
long freespaceaddr(pid_t pid)
{
    FILE *fp;
    char filename[30];
    char line[85];
    long addr;
    char str[20];
    sprintf(filename, "/proc/%d/maps", pid);
    fp = fopen(filename, "r");
    if(fp == NULL)
        exit(1);
    while(fgets(line, 85, fp) != NULL) {
        sscanf(line, "%lx-%*lx %*s %*s %s", &addr,
               str, str, str, str);
        if(strcmp(str, "00:00") == 0)
            break;
    }
    fclose(fp);
    return addr;
}
Each line in /proc/pid/maps represents a mapped region of the process. An entry in /proc/pid/maps looks like this:
map start-mapend    protection  offset     device
inode      process file
08048000-0804d000   r-xp        00000000   03:08
66111      /opt/kde2/bin/kdeinit
The following program injects code into free space. It's similar to the previous injection program except the free space address is used for keeping our new code. Here is the source code for the main function:
int main(int argc, char *argv[])
{ pid_t traced_process;
struct user_regs_struct oldregs, regs;
long ins;
int len = 41;
char insertcode[] =
"/xeb/x15/x5e/xb8/x04/x00"
"/x00/x00/xbb/x02/x00/x00/x00/x89/xf1/xba"
"/x0c/x00/x00/x00/xcd/x80/xcc/xe8/xe6/xff"
"/xff/xff/x48/x65/x6c/x6c/x6f/x20/x57/x6f"
"/x72/x6c/x64/x0a/x00";
char backup[len];
long addr;
if(argc != 2) {
printf("Usage: %s <pid to be traced>/n",
argv[0], argv[1]);
exit(1);
}
traced_process = atoi(argv[1]);
ptrace(PTRACE_ATTACH, traced_process,
NULL, NULL);
wait(NULL);
ptrace(PTRACE_GETREGS, traced_process,
NULL, ®s);
addr = freespaceaddr(traced_process);
getdata(traced_process, addr, backup, len);
putdata(traced_process, addr, insertcode, len);
memcpy(&oldregs, ®s, sizeof(regs));
regs.eip = addr;
ptrace(PTRACE_SETREGS, traced_process,
NULL, ®s);
ptrace(PTRACE_CONT, traced_process,
NULL, NULL);
wait(NULL);
printf("The process stopped, Putting back "
"the original instructions/n");
putdata(traced_process, addr, backup, len);
ptrace(PTRACE_SETREGS, traced_process,
NULL, &oldregs);
printf("Letting it continue with "
"original flow/n");
ptrace(PTRACE_DETACH, traced_process,
NULL, NULL);
return 0;
}
So what happens within the kernel now? How is ptrace implemented? This section could be an article on its own; however, here's a brief description of what happens.
When a process calls ptrace with PTRACE_TRACEME, the kernel sets up the process flags to reflect that it is being traced:
Source: arch/i386/kernel/ptrace.c
if (request == PTRACE_TRACEME) {
    /* are we already being traced? */
    if (current->ptrace & PT_PTRACED)
        goto out;
    /* set the ptrace bit in the process flags. */
    current->ptrace |= PT_PTRACED;
    ret = 0;
    goto out;
}
When a system call entry is done, the kernel checks this flag and calls the trace system call if the process is being traced. The gory assembly details can be found in arch/i386/kernel/entry.S.
Now, we are in the sys_trace() function as defined in arch/i386/kernel/ptrace.c. It stops the child and sends a signal to the parent notifying that the child is stopped. This wakes up the waiting parent, and it does the ptrace magic. Once the parent is done, and it calls ptrace(PTRACE_CONT, ..) or ptrace(PTRACE_SYSCALL, ..), it wakes up the child by calling the scheduler function wake_up_process(). Some other architectures can implement this by sending a SIGCHLD to child.
ptrace may appear to be magic to some people, because it can examine and modify a running program. It is generally used by debuggers and system call tracing programs, such as ptrace. It opens up interesting possibilities for doing user-mode extensions as well. There have been a lot of attempts to extend the operating system on the user level. See Resources to read about UFO, a user-level extension to filesystems. ptrace also is used to employ security mechanisms.


 95
95


 被折叠的 条评论
为什么被折叠?
被折叠的 条评论
为什么被折叠?
 到【灌水乐园】发言


