vue 图表组件
可视图 (vue-graph)
A vue component library based on the JUI charts available in vuejs.
基于vuejs中可用的JUI图表的vue组件库。
安装 (Installation)
NPM (NPM)
npm install --save vue-graph浏览器 (Browser)
Just download dist/vue-graph.js and include it in your HTML file:
只需下载dist/vue-graph.js并将其包含在您HTML文件中:
<script src="https://cdnjs.cloudflare.com/ajax/libs/vue/2.5.16/vue.js"></script>
<script src="https://cdn.rawgit.com/juijs/vue-graph/2216ae2f/dist/vue-graph.js"></script>
ES模块 (ES Modules)
插入 (Plug-In)
import Vue from 'vue'
import VueGraph from 'vue-graph'

Vue.use(VueGraph)
组件 (Components)
import Vue from 'vue'
import GraphLine3D from 'node_modules/vue-graph/src/components/line3d.js'
import NoteWidget from 'node_modules/vue-graph/src/components/widgets/note.js'
import LegendWidget from 'node_modules/vue-graph/src/components/widgets/legends.js'

Vue.component(GraphLine3D.name, GraphLine3D);
Vue.component(NoteWidget.name, NoteWidget);
Vue.component(LegendWidget.name, LegendWidget);
用法 (Usage)
Unlike other chart components, vue-graph have child nodes in the chart called widgets. The widget is used as an additional function of charts such as chart title, legend, tooltip.
与其他图表组件不同,vue-graph在图表中具有称为小部件的子节点。 该小部件用作图表的附加功能,例如图表标题,图例,工具提示。
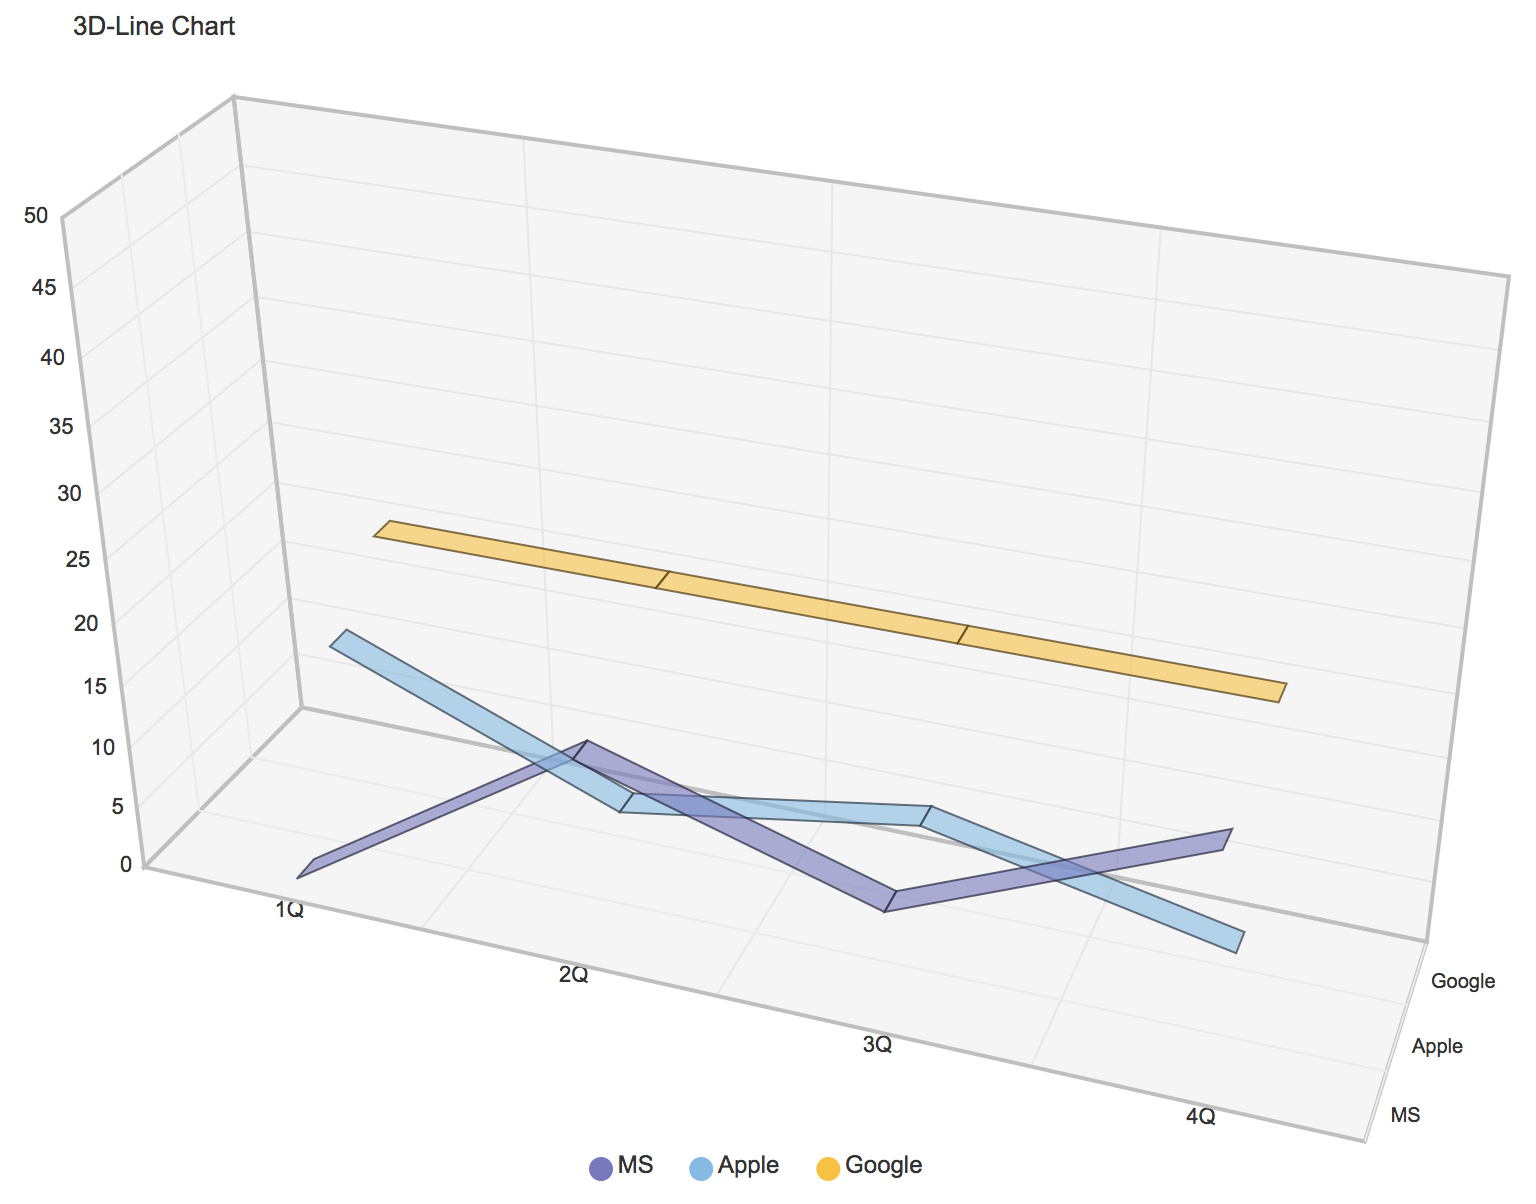
The following is a link you can test with CodePen.
以下是您可以使用CodePen测试的链接。

<div id="app">
    <graph-line3d
            :width="800"
            :height="600"
            :axis-min="0"
            :axis-max="50"
            :padding-top="100"
            :padding-bottom="100"
            :depth="180"
            :labels="[ '1Q', '2Q', '3Q', '4Q' ]"
            :names="names"
            :values="values">
        <note :text="'3D-Line Chart'" :align="'left'"></note>
        <legends :names="names"></legends>
    </graph-line3d>
</div>
In the following code, the chart is prefixed with 'graph-' for each type. The widget can be added as a child node of the chart, unlike a chart, was named without a prefix.
在以下代码中,每种类型的图表都以“ graph-”为前缀。 可以将小部件添加为图表的子节点,与图表不同的是,该小部件的命名没有前缀。
The vue-graph can be combined with charts and widgets for a variety of visualizations. This is a very flexible and scalable structure.
Vue图形可以与图表和小部件结合使用,以实现各种可视化效果。 这是一个非常灵活和可扩展的结构。
var vm = new Vue({
    el: "#app",
    data: {
        names: [ "MS", "Apple", "Google" ],
        values: [
            [ 0, 15, 8, 18 ],
            [ 15, 6, 10, 5 ],
            [ 20, 20, 20, 20 ]
        ]
    }
});
实施图表清单 (Implemented chart list)
There are many charts that have not yet been migrated. We are going to continue.
许多图表尚未迁移。 我们将继续。
道具 (Props)
共同 (Common)
| Name | Type | Required | Watch | Default | Description |
|---|---|---|---|---|---|
| theme | String | false | false | jennifer |
Supports a total of five themes (jennifer, dark, pastel, gradient, pattern) |


 vue-graph是一个基于Vue.js的组件库,它利用JUI图表提供多种图表功能,包括条形图、折线图、散点图等。组件允许添加小部件,如标题、图例和工具提示,以增强图表的可视化效果。
 最低0.47元/天 解锁文章


 3243
3243

 被折叠的 条评论
为什么被折叠?


