


vs code调试代码
Visual Studio Code has an amazing amount of functionality built in, including support for debugging applications. Although the functionality is there, it took me several tries to figure out how to get things configured to debug Node applications. It became even more tricky when using Nodemon, so I figured it was worth it to share the various configurations I've learned. This article will not dive deep into inspecting variables, call stack, etc. but will focus more on the actual configurations. If you are looking for an article more focused on applied debuggging concepts, check out Debugging JavaScript in Chrome and Visual Studio Code.
Visual Studio Code内置了许多功能,包括对调试应用程序的支持。 尽管具有该功能,但我花了我几次尝试才能弄清楚如何配置东西来调试Node应用程序。 使用Nodemon时,它变得更加棘手,因此我认为值得分享所学的各种配置。 本文不会深入探讨检查变量,调用堆栈等内容,而是将重点更多地放在实际配置上。 如果您正在寻找更侧重于应用调试概念的文章,请查看Chrome和Visual Studio Code中的调试JavaScript 。
TLDR-Visual Studio代码中的调试节点 ( TLDR - Debugging Node in Visual Studio Code )
- Download Debugger for Chrome extension 下载Debugger for Chrome扩展程序
- Create Debug configuration from one of the 4 below 从以下4个之一创建Debug配置
- Launch Debug configuration 启动调试配置
- Set breakpoints, inspect variables, etc. 设置断点,检查变量等。
建立 ( Setup )
For this article, I'm giong to be debugging an application called 'Quick Chat'.
对于本文,我非常希望调试一个名为“快速聊天”的应用程序。
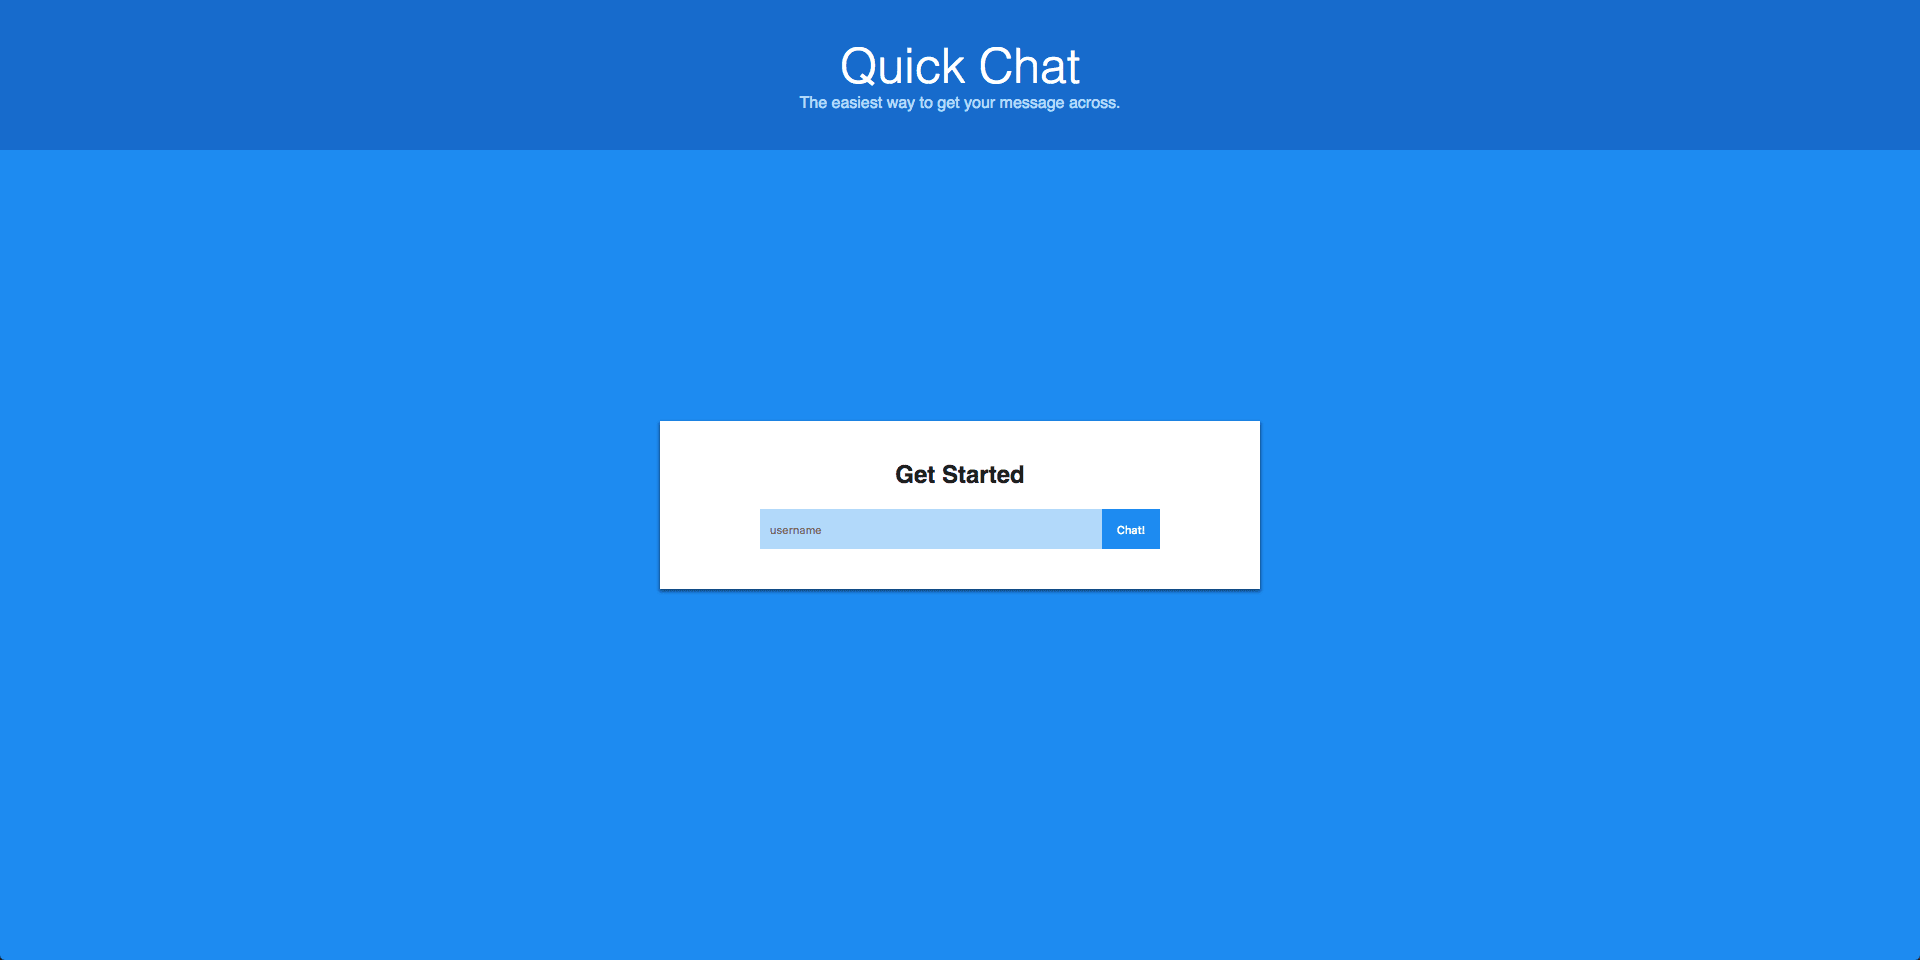
While it is not required for you to run the same application, you can easily follow this video series to build the application yourself or clone the source code if you choose.
尽管不需要运行相同的应用程序,但是您可以轻松按照以下视频系列自行构建应用程序,也可以根据需要克隆源代码 。

After choosing an application to Debug, you will need to install the 'Debugger for Chrome' extension.
选择要调试的应用程序后,您需要安装“ Chrome调试器”扩展程序。

With that taken care of let's create a breakpoint in our app. The Quick Chat application is a simple Node/Express app that uses Socket.io to allow users to chat with each other in real time. Therefore, I decided to add a breakpoint where a client connects to our server. As you can see in the screenshot below, I've created a breakpoint (the red circle) just inside the function that gets called each time a user gets connected. For reference, to create a breakpoint in VS Code, click in the gutter, or empty space, to the left of the line numbers. Regardless of what application you are debugging, set a breakpoint that can be triggered easily (ex. when the application loads, a route is triggered, etc.).
有了这一点,让我们在应用程序中创建一个断点。 快速聊天应用程序是一个简单的Node / Express应用程序,它使用Socket.io允许用户实时相互聊天。 因此,我决定在客户端连接到我们的服务器的地方添加一个断点。 如下面的屏幕快照所示,我在函数内部创建了一个断点(红色圆圈),每次用户连接时都会调用该断点。 作为参考,要在VS Code中创建断点,请单击行号左侧的装订线或空白区域。 无论您要调试哪个应用程序,都应设置一个易于触发的断点(例如,在应用程序加载时,触发路由等时)。
To create a breakpoint in VS Code, click in the gutter, or empty space, to the left of the line numbers
要在VS Code中创建断点,请单击行号左侧的装订线或空白

VS代码调试面板 ( VS Code Debugging Panel )
To open the Debug panel, click on the bug looking icon on the sidebar (on the left side by default). I won't dive too deep into this, but notice quickly that there are four different sections: variables, watch, call stack, and breakpoints.
要打开“调试”面板,请单击侧栏上的错误查找图标(默认为左侧)。 我不会对此进行深入研究,但是请Swift注意有四个不同的部分:变量,监视,调用堆栈和断点。

Again, for more background into what these sections mean, check out Debugging JavaScript in Chrome and Visual Studio Code.
同样,有关这些部分的含义的更多背景信息,请查看Chrome和Visual Studio Code中的调试JavaScript。
At the top of the panel you will see a green play button and a dropdown that says 'No Configurations' if you have yet to create a debug configuration. If you have already created a configuation, you'll see it listed there. The great thing about creating these debug configurations is that VS Code is happy to help.
如果尚未创建调试配置,则在面板顶部会看到一个绿色的播放按钮和一个下拉菜单,显示“无配置”。 如果您已经创建了配置,则会在其中列出它。 创建这些调试配置的妙处在于VS Code很乐意提供帮助。
VS Code stores debug configurations in a file called launch.json inside of a folder .vscode. VS Code helps us not only create that folder and file, but also helps to generate predefined configurations as well. Let's take a look at creating our first one.
VS Code将调试配置存储在文件夹.vscode内名为launch.json的文件中。 VS Code不仅可以帮助我们创建该文件夹和文件,而且还可以帮助生成预定义的配置。 让我们来看看创建第一个。
To create your initial launch.json file, click the 'No Configurations' dropdown and choose 'Add Configuration'. From here, ignore the popup and we will get started creating our first configuration.
要创建您的初始launch.json文件,请单击“无配置”下拉菜单,然后选择“添加配置”。 从这里开始,忽略弹出窗口,我们将开始创建第一个配置。
调试配置的关键组件 (Key Components of a Debug Configuration)
- name - the name of the configuration as displayed in the configurations dropdown name-在配置下拉列表中显示的配置名称
- request - the type of action that you want to take 请求-您要执行的操作类型
- type (Node, Chrome, PHP, etc.) 类型(节点,Chrome,PHP等)
As you create different configurations, VS Code will also provide intellisense for other properties that can be defined.
当您创建不同的配置时,VS Code还将为可以定义的其他属性提供智能感知。
调试配置1(启动节点程序) ( Debug Configuration 1 (Launch Node Program) )

This first configuration will launch our Node application for us in debug mode. Running in debug mode means that VS Code will be able to connect to our app over a specific port for debugging. For this configuration, we mainly need to define the program file that will be run. The configuration looks like this.
第一个配置将以调试模式为我们启动Node应用程序。 在调试模式下运行意味着VS Code将能够通过特定端口连接到我们的应用进行调试。 对于此配置,我们主要需要定义将要运行的程序文件。 配置看起来像这样。
To run this configuration, choose it from the configurations dropdown list, and click the green play/run button. You're debug action bar will pop up in the top right with step, continue, restart, and stop buttons.
要运行此配置,请从配置下拉列表中选择它,然后单击绿色的播放/运行按钮。 您正在调试操作栏将在右上角弹出,其中包含步骤,继续,重新启动和停止按钮。

One thing you might have noticed is the warning I've got in my debug console. It mentioned that node --debug has been deprecated. Honestly, I'm not sure if this is VS Code's fault or the version of Node that I have. Either way, there's one thing to remember. To start a Node application in debug mode going forward, use the --inspect flag.
您可能已经注意到的一件事是调试控制台中出现了警告。 它提到不推荐使用node --debug 。 老实说,我不确定这是VS Code的错误还是Node的版本。 无论哪种方式,都需要记住一件事。 要继续以调试方式启动Node应用程序,请使用--inspect标志。
To start a Node application in debug mode going forward, use the --inspect flag.
要继续以调试方式启动Node应用程序,请使用--inspect标志。
调试配置2(按进程ID附加) ( Debug Configuration 2 (Attach by Process ID) )
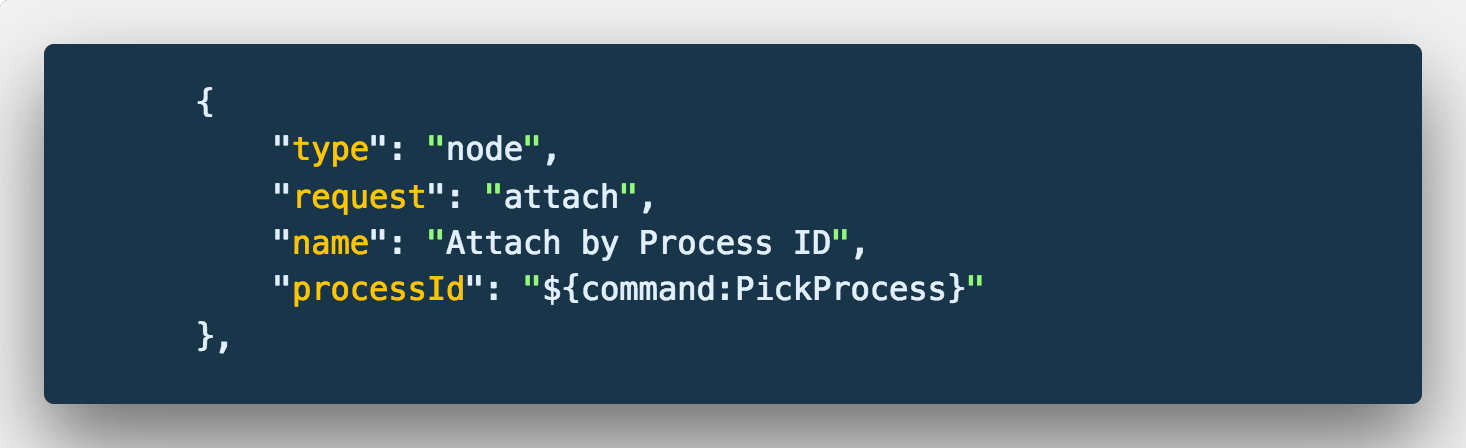
The second configuration, we'll look at is attaching to a Node process by id. For this, we will need to start our Node server ourselves before running the debug configuration. Use the following command to start your server (using --inspect as mentioned above) and replace app.js with the name of your server file.
我们将看到的第二种配置是按id附加到Node进程。 为此,我们需要在运行调试配置之前自行启动节点服务器。 使用以下命令启动服务器(如上所述,使用--inspect),并将app.js替换为服务器文件的名称。
node --inspect app.js
node --inspect app.js

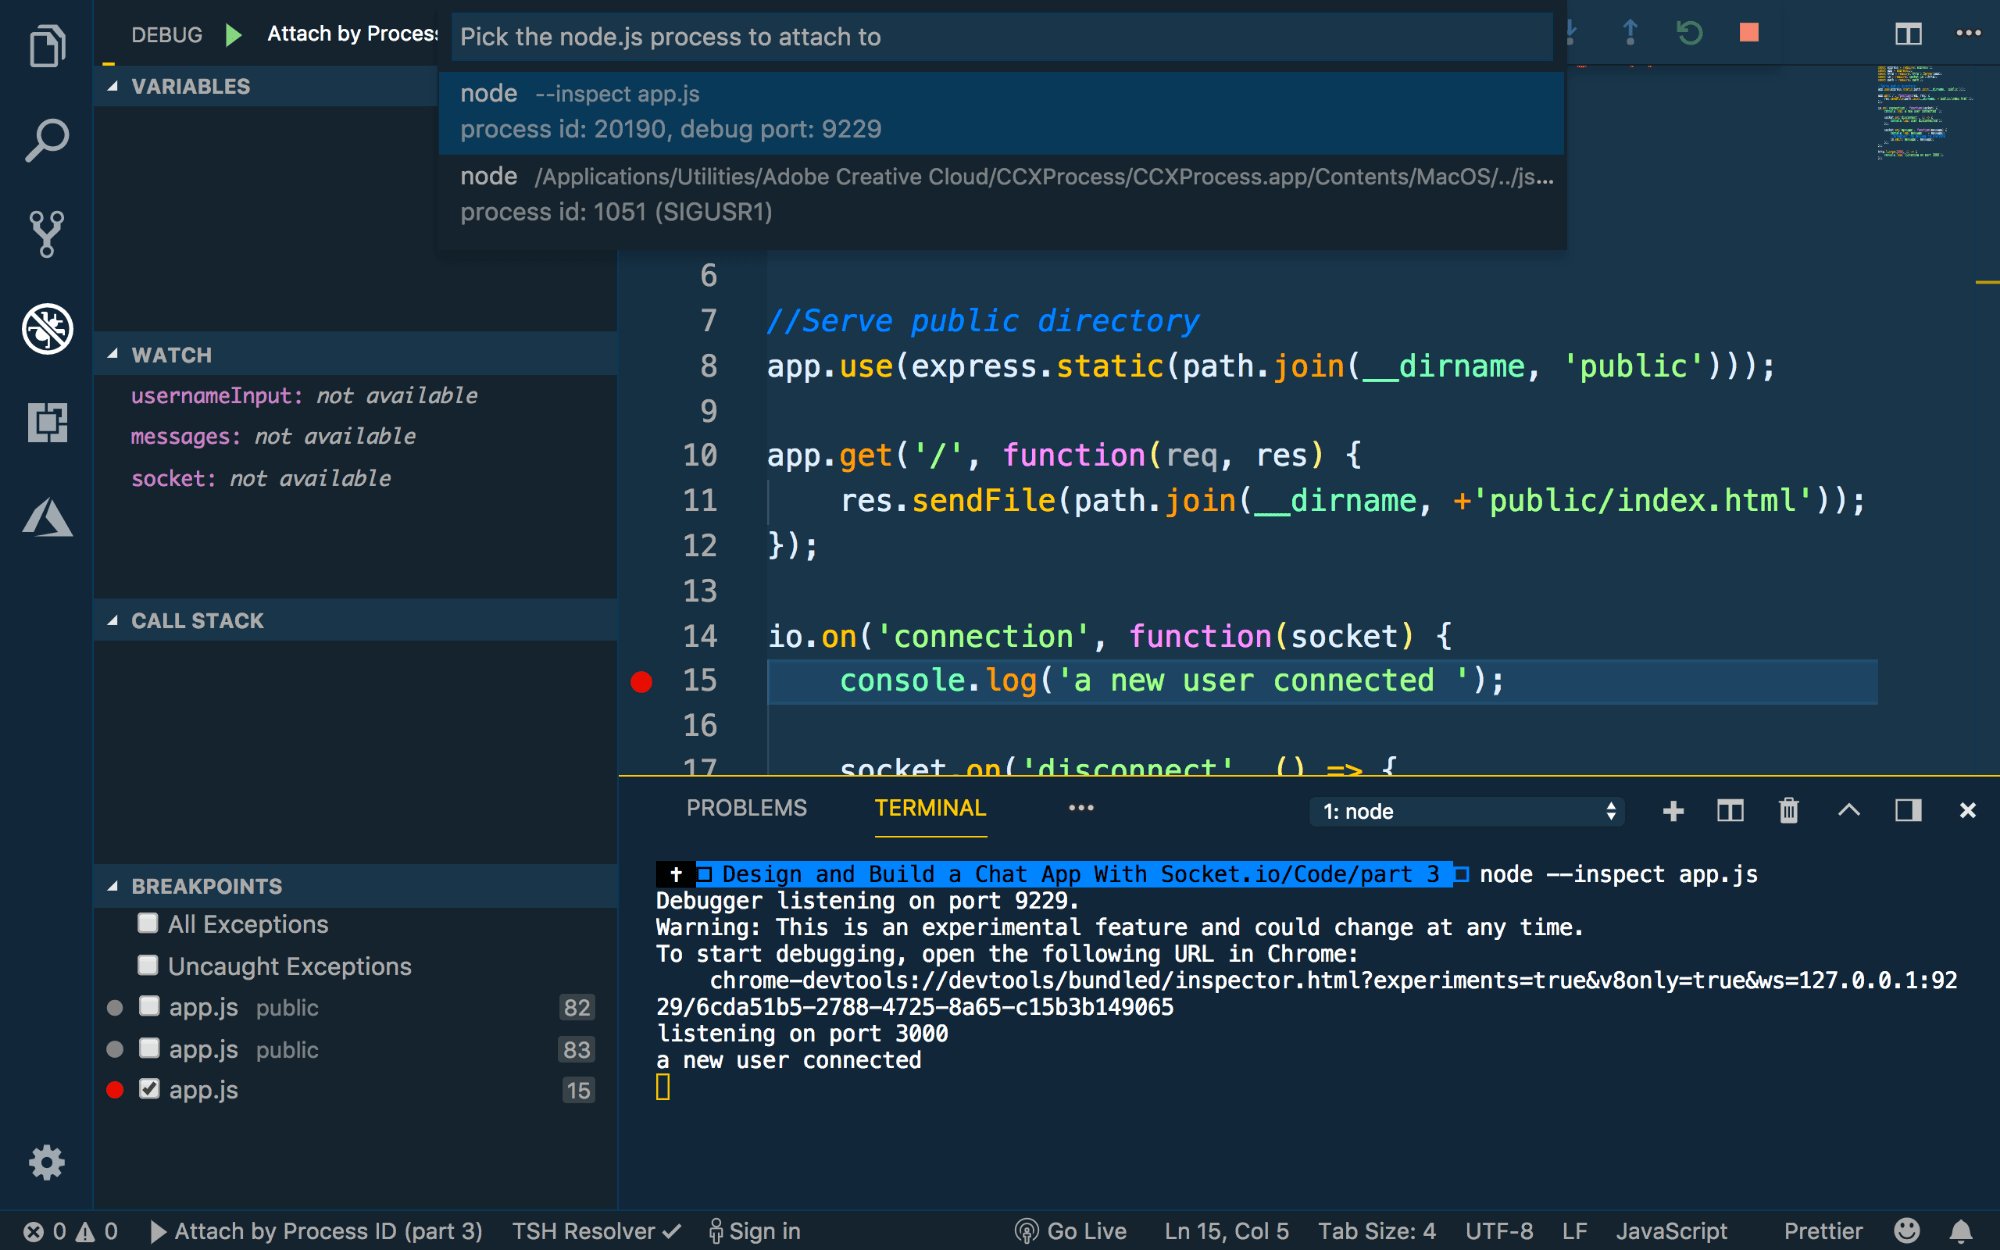
With your server started, now you can run your debug configuration. When prompted, choose Node process that corresponds to the command we just ran to start our server.
随着服务器启动,现在您可以运行调试配置。 出现提示时,选择与我们刚启动服务器的命令相对应的Node进程。
Successfully connected!
连接成功!

调试配置3(附加到端口) ( Debug Configuration 3 (Attach to Port) )
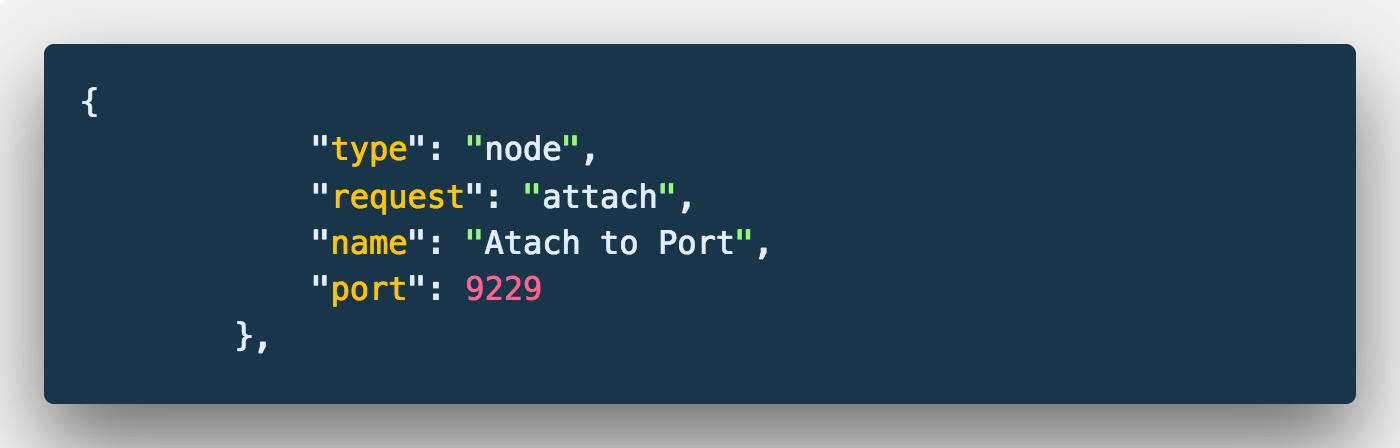
For our third configuration, we will be attaching to an existing Node application running on a given port. 9229 is the default port for debugging when using the --inspect flag so that's what we're going to use. Since we've already started our server with the previous configuration, we can just start our debug configuration. Choose "Attach to Port" configuration and click play!
对于第三个配置,我们将附加到在给定端口上运行的现有Node应用程序。 9229是使用--inspect标志时用于调试的默认端口,因此我们将使用此端口。 由于我们已经使用先前的配置启动了服务器,因此我们只需启动调试配置即可。 选择“附加到端口”配置,然后单击播放!

调试配置4(使用Nodemon附加到端口) ( Debug Configuration 4 (Attach to Port with Nodemon) )
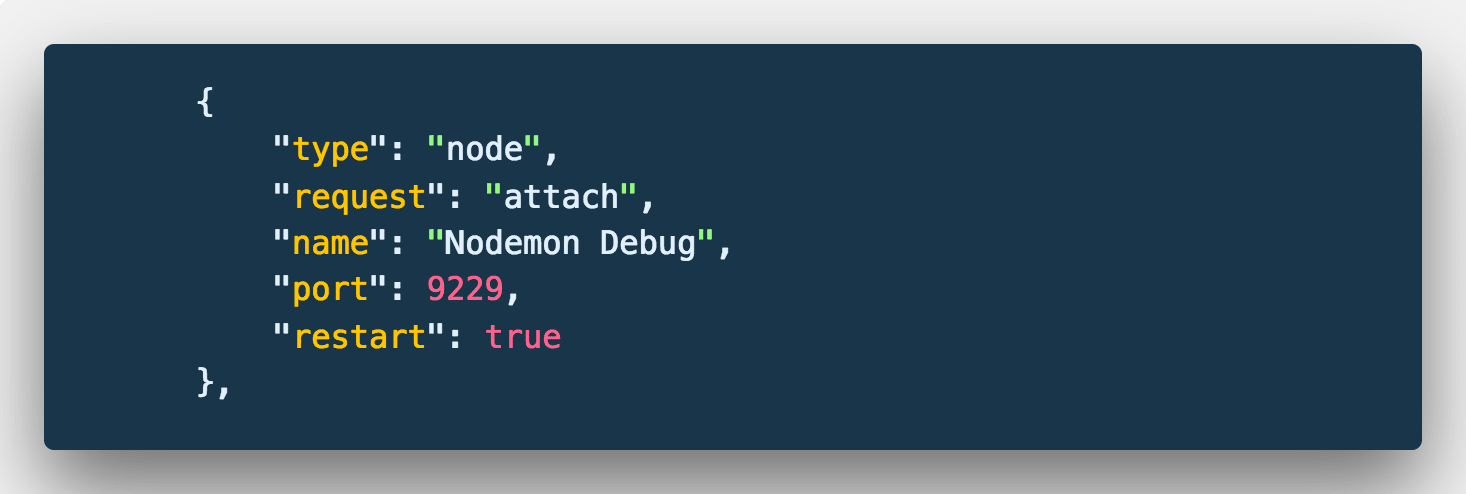
For our final configuration, we are going to tweak the previous one to support auto reloading with Nodemon. Before I explain what Nodemon is, it's important to know that I consider this the most useful configuration in my day to day development.
对于我们的最终配置,我们将调整前一个配置以支持Nodemon的自动重新加载。 在我解释什么是Nodemon之前,重要的是要知道我认为这是我日常开发中最有用的配置。
Nodemon is a package, typically installed globally from NPM, that will auto reload your Node server as you save your files
Nodemon是一个软件包,通常从NPM全局安装,在保存文件时会自动重新加载Node服务器
For those of your who don't know, Nodemon is a package, typically installed globally from NPM, that will auto reload your Node server as you save your files. This is incredibly useful as your are making changes and testing at the same time. I almost always run my Node application with Nodemon during development, and I would recommend you do too.
对于您不知道的人,Nodemon是一个软件包,通常从NPM全局安装,在保存文件时会自动重新加载Node服务器。 这在您同时进行更改和测试时非常有用。 在开发过程中,我几乎总是与Nodemon一起运行Node应用程序,我建议您也这样做。
To install Nodemon, use the following command.
要安装Nodemon,请使用以下命令。
npm install -g nodemon
npm install -g nodemon
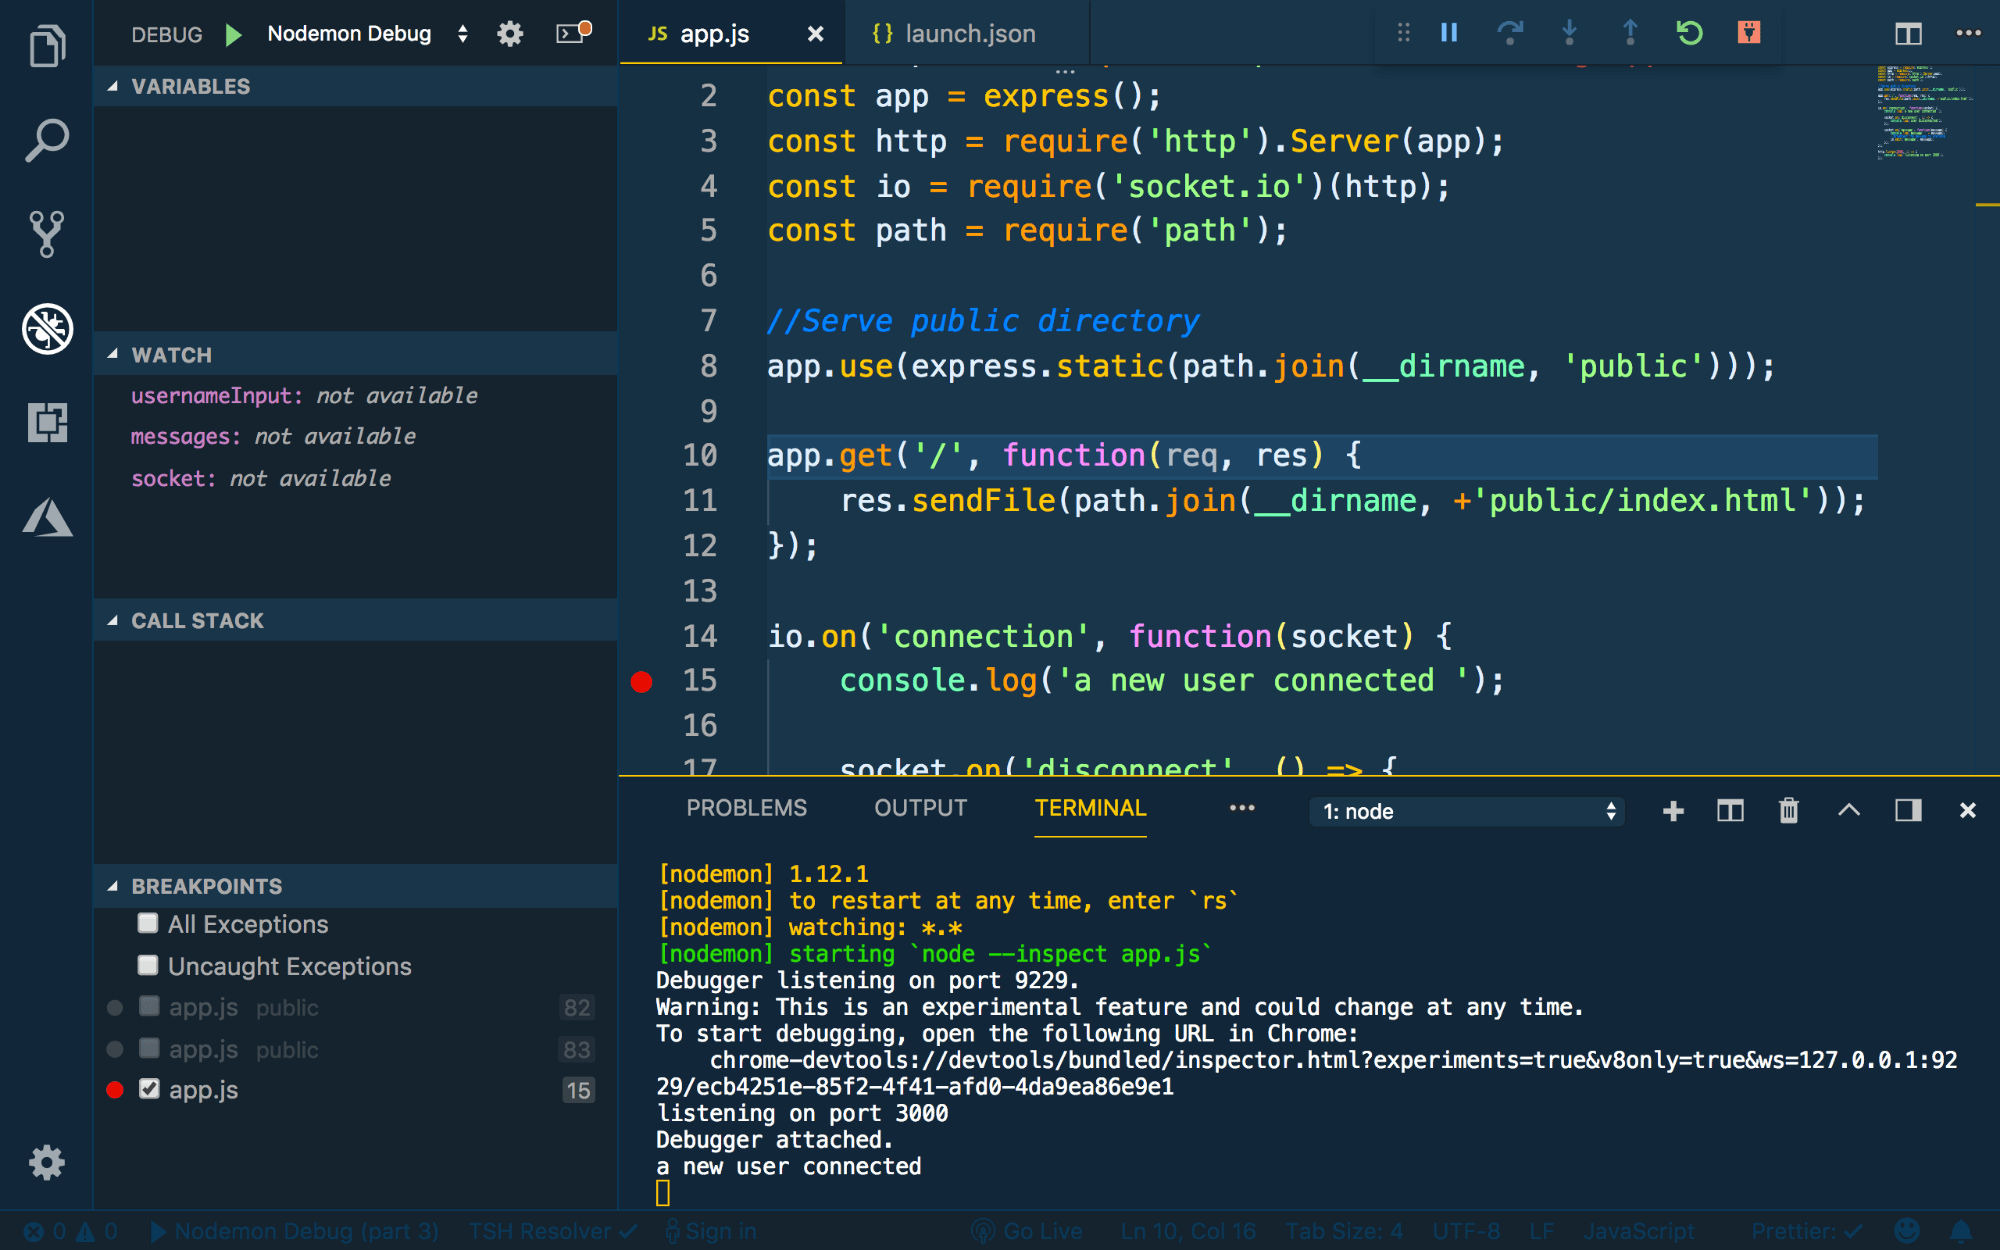
Because Nodemon will auto restart our server, in the debug configuration, we've set the restart property to true. This way, our debugger will reconnect when our server restarts. To test this out, run your server using this command (replacing node, from earlier, with nodemon). Obviously, make sure that you canceled your previously running server.
由于Nodemon将自动重启服务器,因此在调试配置中,我们将restart属性设置为true。 这样,调试器将在服务器重新启动时重新连接。 要对此进行测试,请使用此命令运行服务器(从前用nodemon替换node)。 显然,请确保已取消先前运行的服务器。
nodemon --inspect app.js
nodemon --inspect app.js

Then, run your configuration.
然后,运行您的配置。
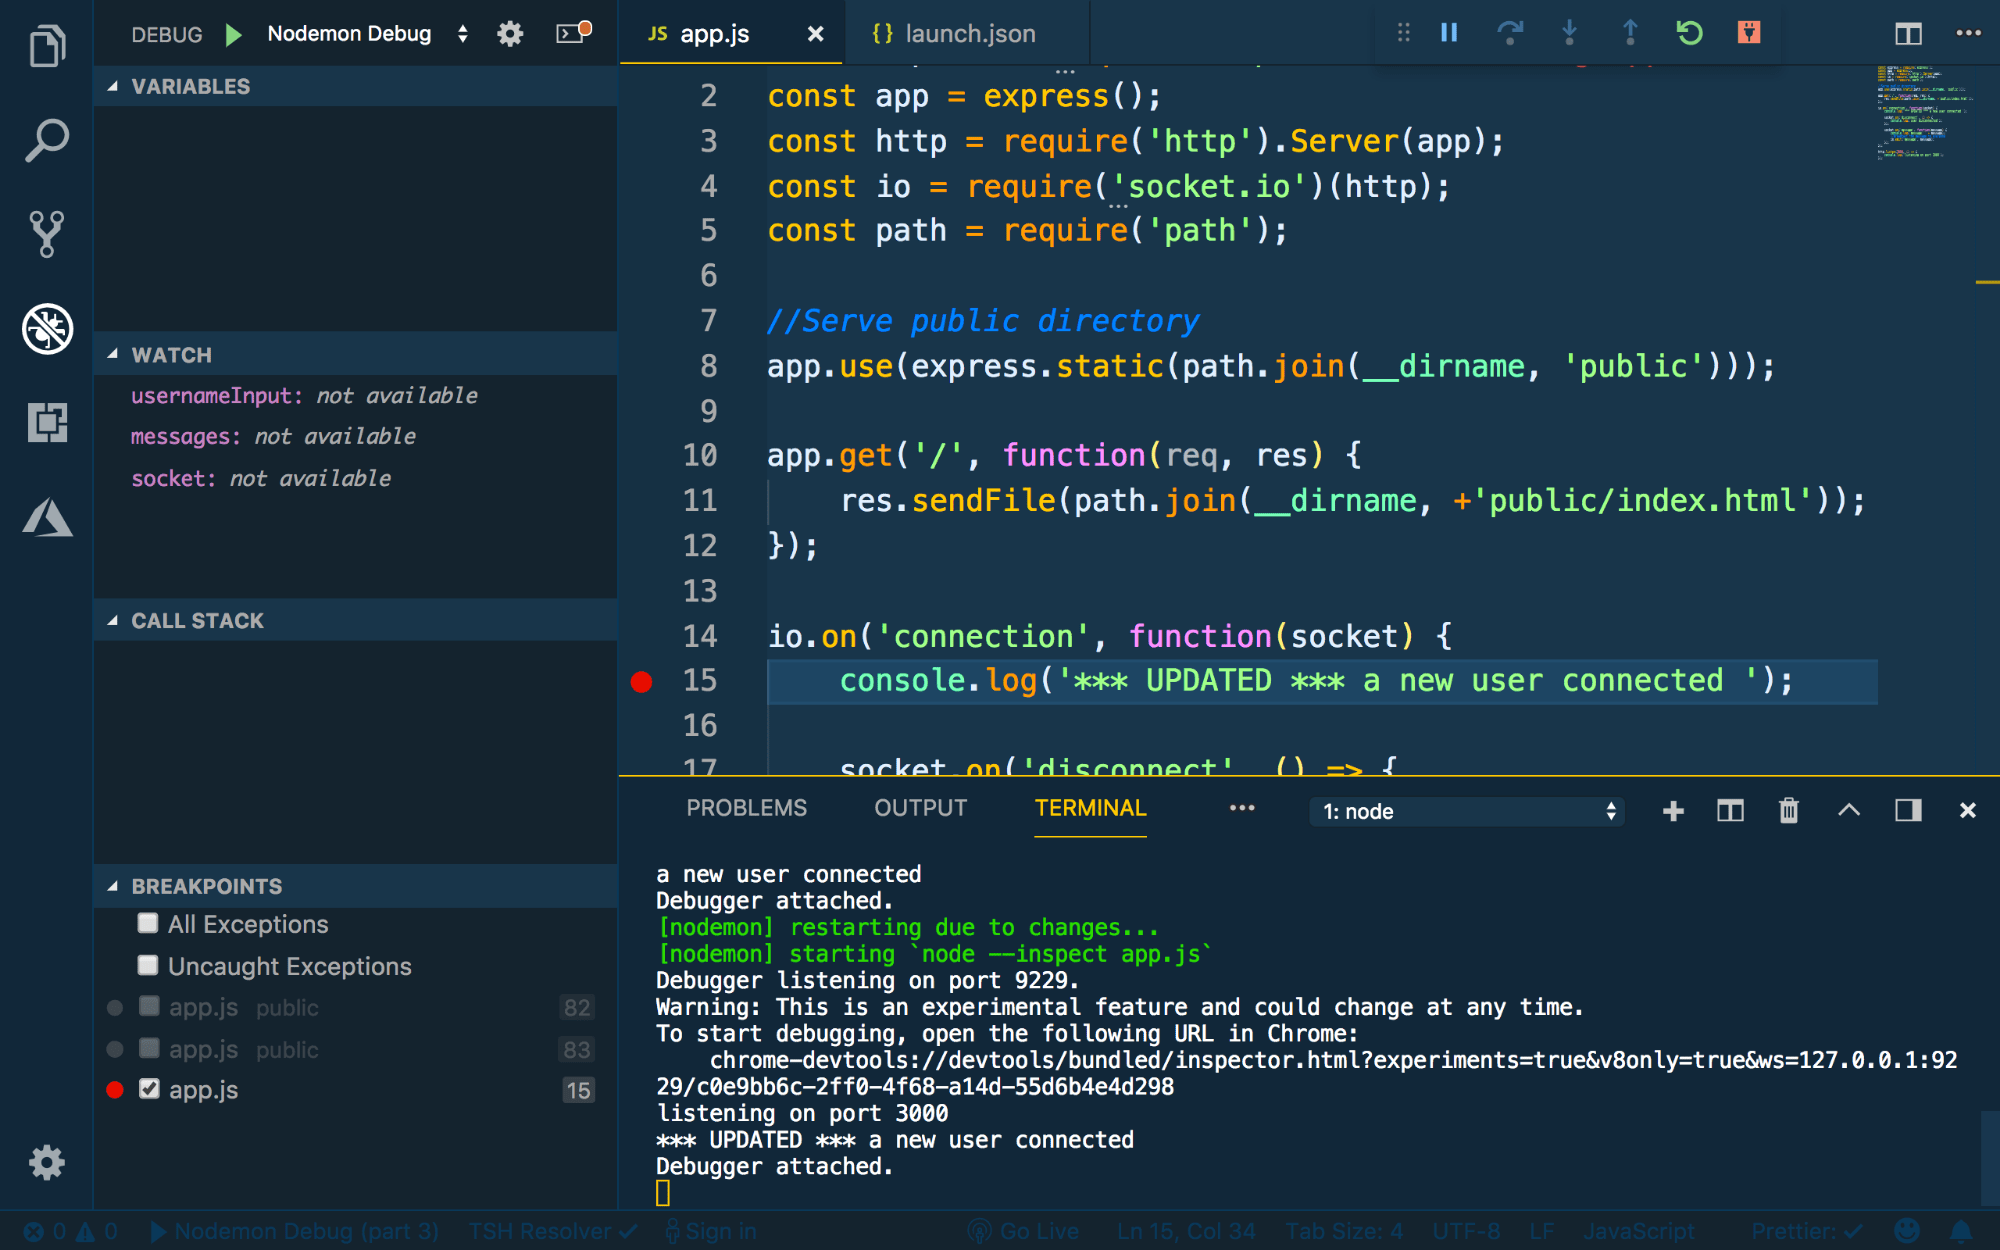
Keep in mind, we are using Nodemon. So, if we make a change to our server file and save it, our server will automatically be reloaded. Thankfully, we've defined our debug configuration to handle this scenario and reconnect as well. Make a small change to your file, save it, and make sure that your debugger reconnects when the server restarts.
请记住,我们正在使用Nodemon。 因此,如果我们更改服务器文件并将其保存,则服务器将自动重新加载。 幸运的是,我们已经定义了调试配置来处理这种情况并重新连接。 对文件进行少量更改,将其保存,并确保在服务器重新启动时调试器重新连接。
结语 ( Wrap Up )
As I mentioned earlier, getting started debugging in VS Code took me a bit to figure out. The main issue I had was defining configurations appropriately, which is why I created this article. I hope that this gives you guys a clear idea of the available configurations when debugging Node in VS Code.
正如我之前提到的,开始使用VS Code进行调试使我有些费解。 我遇到的主要问题是正确定义配置,这就是我创建本文的原因。 我希望这能给你们一个在VS Code中调试Node时可用配置的清晰思路。
If you have any follow up questions or comments, leave one below of find me on twitter @jamesqquick.
如果您有任何后续问题或意见,请在twitter @jamesqquick上留下以下“找到我”的内容 。
翻译自: https://scotch.io/tutorials/debugging-node-code-in-vs-code
vs code调试代码


 1万+
1万+

 被折叠的 条评论
为什么被折叠?
被折叠的 条评论
为什么被折叠?
 到【灌水乐园】发言


