


视觉测试
There are tons of tools out there that help you make sure your app is functioning perfectly, but how do you catch bugs that are purely visual?
有大量工具可以帮助您确保应用程序正常运行,但是如何捕获纯可视化的错误?

In the example above, the button still works, and the text is actually still there, but the link somehow changed to be the same color as the button.
在上面的示例中,按钮仍然有效,并且文本实际上仍然存在,但是链接以某种方式更改为与按钮相同的颜色。
You could write regression tests to ensure that the text is always white, and the button is always green, but across hundreds of pages and states, that becomes unruly very fast. So in lieu of (or in addition to) writing line after line of regression tests, you might manually check all those pages before deploying. But we all know how time-consuming and imperfect manual QA can be.
您可以编写回归测试以确保文本始终为白色,按钮始终为绿色,但是在数百个页面和状态中,这变得非常快。 因此,代替(或除了)编写逐行回归测试之外,您可以在部署之前手动检查所有这些页面。 但是我们都知道手动QA可能很耗时且不完善。
That’s where visual testing comes in.
这就是视觉测试的用武之地。
*Visual testing is the new way to have 100% confidence in your UI. *Instead of manually checking your UI or testing the code underneath, visual testing detects pixel-by-pixel changes on every commit automatically. Visual testing saves you time reviewing code and ensuring no visual bugs make their way to production.
* 视觉测试是让您的UI拥有100%信心的新方法。 *视觉测试无需手动检查您的UI或测试下面的代码,而是自动检测每次提交的逐像素更改。 可视化测试为您节省了检查代码的时间,并确保没有可视化的错误进入生产环境。
In this 5-minute tutorial, we’ll walk through integrating Percy with an example app, reviewing visual changes, and running visual reviews as part of your day-to-day workflow.
在这个5分钟的教程中,我们将逐步完成Percy与示例应用程序的集成,审查视觉更改,并在日常工作流程中运行视觉评论。
步骤1:整合Percy ( Step 1: Integrate Percy )
If you haven’t already, sign up for a Percy account, name your organization, and create your first project.
如果尚未注册,请注册一个Percy帐户,命名您的组织,然后创建您的第一个项目。

Note: Signing up for a Percy account will kick off a 14-day trial, but once that expires, you’ll be transferred to a free plan that includes 5,000 free snapshots each month.
注意:注册一个Percy帐户将启动14 天的试用期,但是一旦到期,您将被转到一个免费计划,该计划每月包含5,000张免费快照。
Percy projects correspond with the apps, sites, or component libraries you want to test. With our SDKs you can add visual testing to virtually anything that renders in a browser.
Percy项目与您要测试的应用程序,站点或组件库相对应。 使用我们的SDK,您几乎可以将视觉测试添加到浏览器中呈现的任何内容。
These are some of our popular SDKs:
这些是我们一些受欢迎的SDK:
- Cypress.io 赛普拉斯
- Puppeteer 木偶戏
- Storybook for React React的故事书
- Ember web apps Ember Web应用程序
- Capybara for Ruby apps Capybara for Ruby应用
Our SDKs work by importing and calling Percy snapshot commands wherever you’d like visual coverage.
我们的SDK通过导入和调用Percy快照命令来工作,只要您需要可视范围即可。
*For this tutorial, we’ll use PercyScript, which provides a quick and easy way to start doing visual testing in just a couple of lines of JavaScript. *PercyScript can fully interact with elements by clicking, typing, and waiting and can also be used to test live URLs. Read more in our PercyScript documentation.
* 在本教程中,我们将使用PercyScript,它提供了快速简便的方法,仅用几行JavaScript就可以开始进行可视化测试。 * PercyScript可以通过单击,键入和等待与元素进行完全交互,还可以用于测试实时URL。 在我们的PercyScript文档中了解更多信息 。
For this tutorial, we’re going to use this TodoMVC example app. You can easily adapt the PercyScript below to work for your own application.
在本教程中,我们将使用此TodoMVC示例应用程序。 您可以轻松地调整以下PercyScript使其适合您自己的应用程序。
First, let’s setup the example app:
首先,让我们设置示例应用程序:
$git clone https://github.com/percy/example-todomvc.git
$ cd example-todomvc/
$ npm install
$ npm run start
You can now visit http://localhost:8000 and play around with the todos app yourself.
您现在可以访问http://localhost:8000并亲自使用todos应用程序。
Next, we’re going to install PercyScript and write our first visual tests for this application.
接下来,我们将安装PercyScript并为此应用程序编写第一个可视化测试。
Keep the server running, open a new terminal, and run:
保持服务器运行,打开新终端,然后运行:
$npm install -D @percy/scriptThis will add @percy/script to your package.json file.
这会将@percy/script添加到package.json文件。
Next, create a file named snapshots.js and add your first PercyScript:
接下来,创建一个名为snapshots.js的文件,并添加第一个PercyScript:
// snapshots.js
const PercyScript = require('@percy/script');

// A script to navigate our app and take snapshots with Percy.
PercyScript.run(async (page, percySnapshot) => {
  await page.goto('http://localhost:8000');
  await percySnapshot('TodoMVC home page');

  // Enter a new to-do.
  await page.type('.new-todo', 'A really important todo');
  await page.keyboard.press('Enter');
  await percySnapshot('TodoMVC with a new todo', { widths: [768, 992, 1200] });
});
The next step is to start running this PercyScript and seeing visual changes.
下一步是开始运行此PercyScript并查看视觉变化。
步骤2:进行视觉测试 ( Step 2: Run visual tests )
To run your PercyScript locally, copy PERCY_TOKEN from the new project screen, then run:
要在本地运行PERCY_TOKEN ,请从新项目屏幕复制PERCY_TOKEN ,然后运行:
$export PERCY_TOKEN=aaabbbcccdddeee
$ npx percy exec -- node snapshots.js
Note: Be sure to replace the token with your project-specific PERCY_TOKEN.
注意:确保用项目 特定的 PERCY_TOKEN 替换令牌 。
You should see output like:
您应该看到如下输出:
$ npx percyexec -- node snapshots.js
[percy] created build #1: https://percy.io/test/example-todomvc/builds/1738842
[percy] percy has started.
[percy] snapshot taken: 'TodoMVC home page'
[percy] snapshot taken: 'TodoMVC with a new todo'
[percy] stopping percy...
[percy] waiting for 2 snapshots to complete...
[percy] done.
[percy] finalized build #1: https://percy.io/test/example-todomvc/builds/1738842
The PercyScript has run, sending snapshots up to Percy for rendering and processing:
PercyScript已运行,将快照发送到Percy进行渲染和处理:
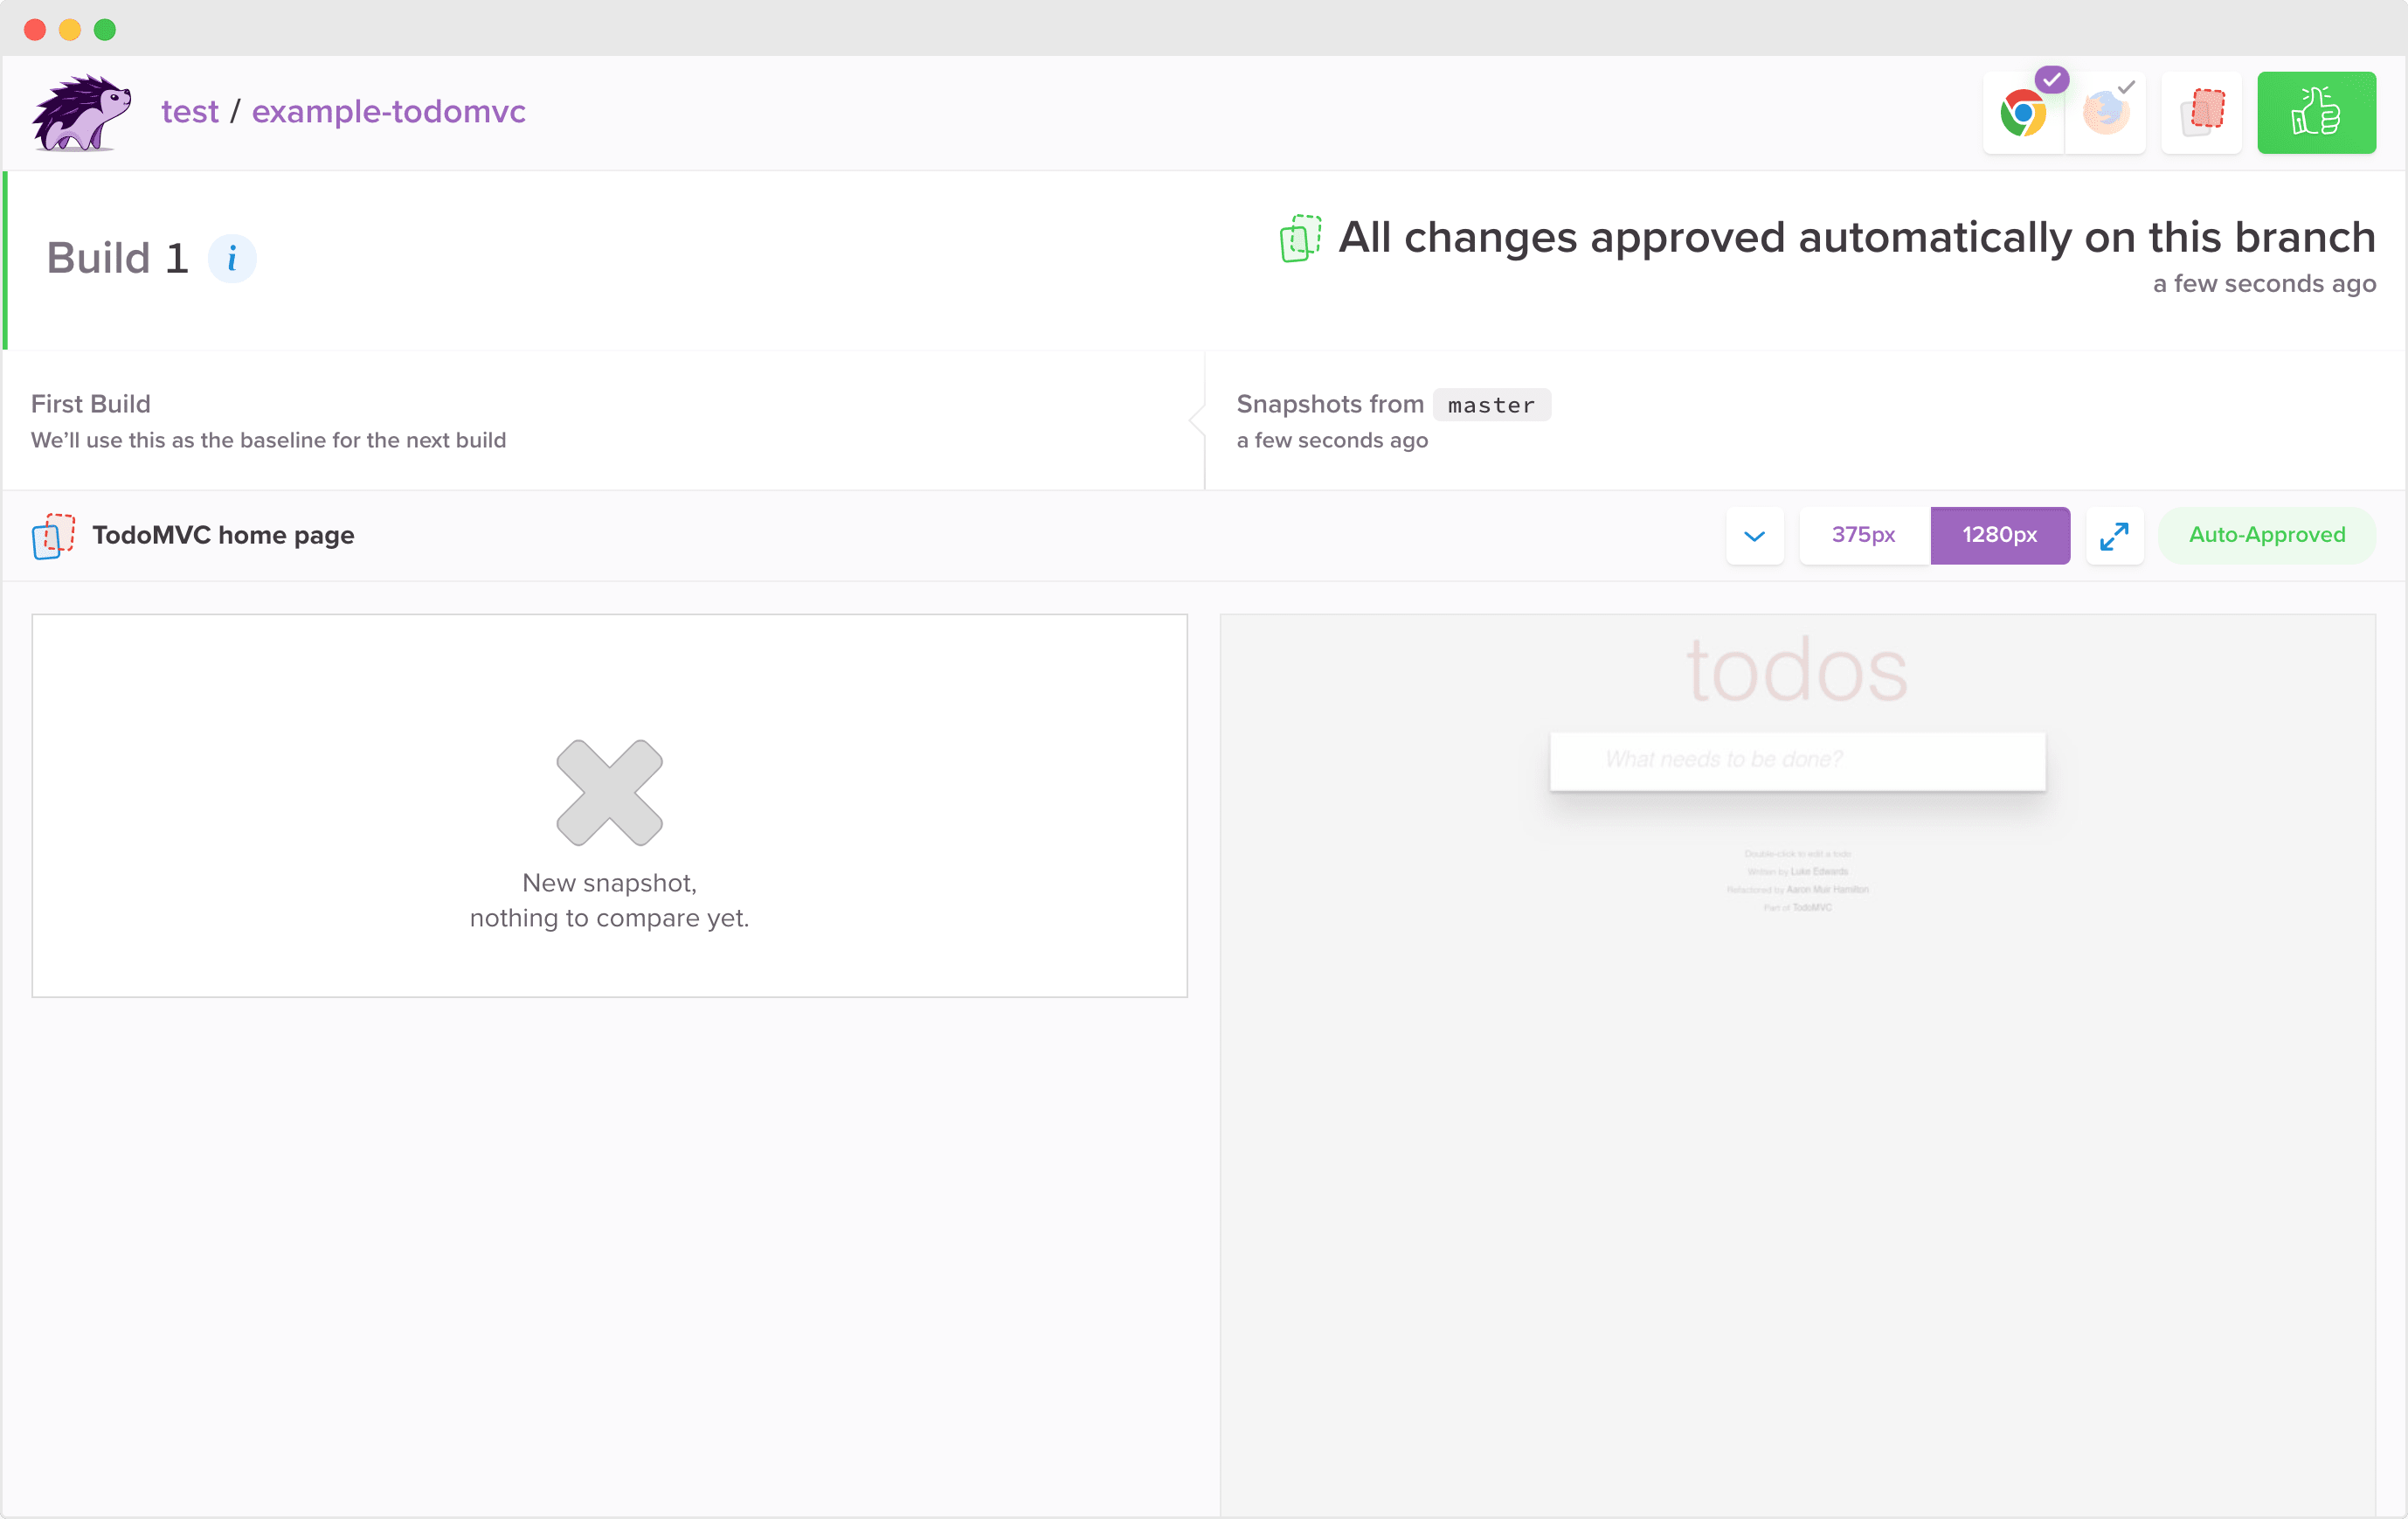
You’ll see that since this is the first build, there isn’t anything to compare it to. It has also been “Auto-Approved” because the commit was on master and we assume that master builds are production-ready.
您会看到,由于这是第一个构建,因此没有任何可与之进行比较的东西。 它也被“自动批准”了,因为提交是在主服务器上的,并且我们认为主服务器构建已经可以投入生产了。
Percy works by capturing the DOM snapshot everywhere the Percy snapshot command is called. We then recreate the page or component in our custom rendering environment. New snapshots are compared against baseline snapshots to determine which pixels have changed.
Percy通过在调用Percy快照命令的任何地方捕获DOM快照来工作。 然后,我们在自定义渲染环境中重新创建页面或组件。 将新快照与基准快照进行比较,以确定哪些像素已更改。
Now that you’re integrated and have pushed your first build establishing your baseline, let’s make a change and review the outcome in Percy!
现在,您已经集成并推动了第一个构建建立基线,让我们进行更改并在Percy中查看结果!
步骤3:检查外观变化 ( Step 3: Review visual changes )
Let’s make a new feature branch and introduce a visual change.
让我们建立一个新的功能分支,并引入视觉上的变化。
Use your text editor to edit index.html and make the h1 text on line 11 purple:
使用文本编辑器编辑index.html并将第11行的h1文本设为紫色:
<h1 style="color:#9e66bf;">Now run the snapshots again:
现在再次运行快照:
$ npx percyexec -- node snapshots.jsOpen up the Percy link, and we can now see the visual change highlighted!
打开Percy链接,我们现在可以看到突出显示的视觉变化!
并排比较 (Side-by-side comparison)
The red areas in the right panel represent pixels that have changed—those changed pixels are called visual diffs.
右侧面板中的红色区域表示已更改的像素-这些更改的像素称为视觉差异。
 Clicking that area (or pressing "d") will toggle between the underlying snapshot and the overlaid diff so you can easily see what exactly has changed.
Pro tip: Click the arrow expansion box for a full-screen view. Cycle through old, new, and diff with your left and right keys, and navigate between snapshots with up and down down keys.
专家提示:单击箭头扩展框可 查看全屏视图。 使用左右键循环浏览旧,新和差异,并使用上下键在快照之间导航。
响应差异 (Responsive diffs)
You’ll notice the widths at which your snapshots have been rendered show up here. In your example we rendered snapshots for mobile and desktop widths.
 Select the various widths to see what has changed across each width.
您会注意到在此处呈现快照的宽度。 在您的示例中,我们呈现了移动和桌面宽度的快照。
跨浏览器视觉测试 (Cross-browser visual testing)
By default, Percy renders all snapshots across both Chrome and Firefox.
 Cross-browser snapshots help you detect subtle differences caused by browser rendering.
默认情况下,Percy会在Chrome和Firefox中呈现所有快照。
If you’re happy with your changes, hit “Approve All” — knowing with 100% confidence what visual changes you’ll be deploying.
如果您对更改感到满意,请单击“全部批准”-100%确信将要部署的视觉更改。
You’ve done your first visual review.
您已经完成了第一次视觉检查。
步骤4:CI和源代码集成 ( Step 4: CI and source code integrations )
To get the most value out of automated visual testing, we recommend integrating visual reviews into your workflow.
为了从自动化视觉测试中获得最大价值,我们建议将视觉评论集成到您的工作流程中。
Configure Percy with your CI service so that visual tests runs every time a CI build is kicked off. Simply add PERCY_TOKEN to your CI environment variables. For more in-depth instructions and to see all of our supported CI services, check out our CI setup documentation.
使用CI服务配置Percy,以便每次启动CI构建时都运行可视化测试。 只需将PERCY_TOKEN添加到您的CI环境变量即可。 有关更深入的说明并查看我们所有受支持的CI服务,请查看我们的CI设置文档 。
Here are a few of our most popular supported services:
以下是我们最受欢迎的一些支持服务:
You can also easily add Percy to your pull/merge requests to be notified when visual changes are detected, and when those changes are approved and ready to merge.
您还可以轻松地将Percy添加到拉/合并请求中 ,以便在检测到视觉更改以及批准这些更改并准备好合并这些更改时得到通知。
Head to your organization settings to give Percy access to GitHub or GitLab. Once you’ve given access, be sure to connect your project to your project's repository. Then the next time you commit, Percy will show up in your pull/merge request checks:
转到您的组织设置,以使Percy可以访问GitHub或GitLab 。 授予访问权限后,请确保将项目连接到项目的存储库。 然后,下次提交时,Percy将显示在您的合并/合并请求检查中:
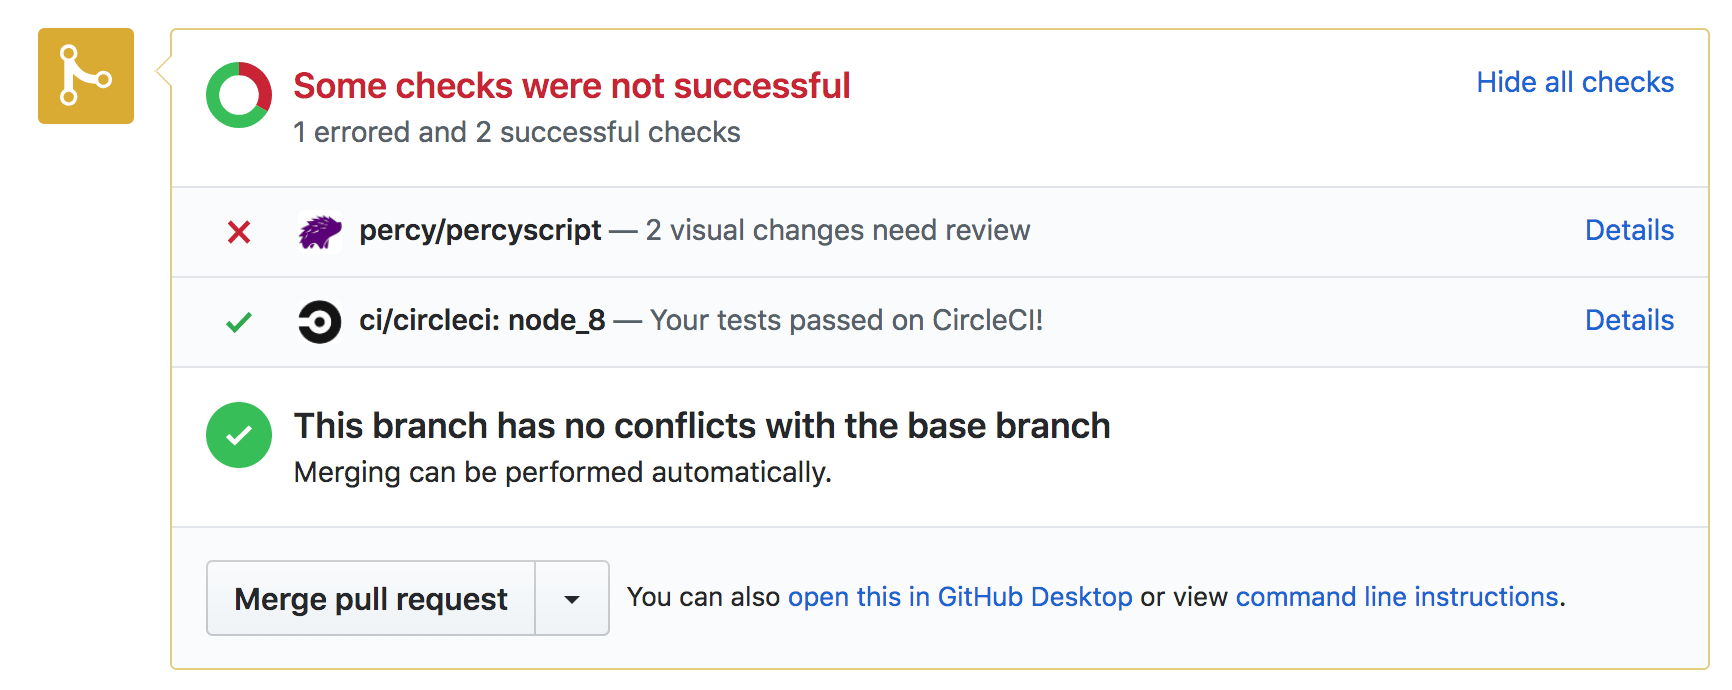 Clicking “Details” will take you right to the Percy UI where you can review visual changes. After snapshots are approved, your commit status will change to green and the PR can be merged:
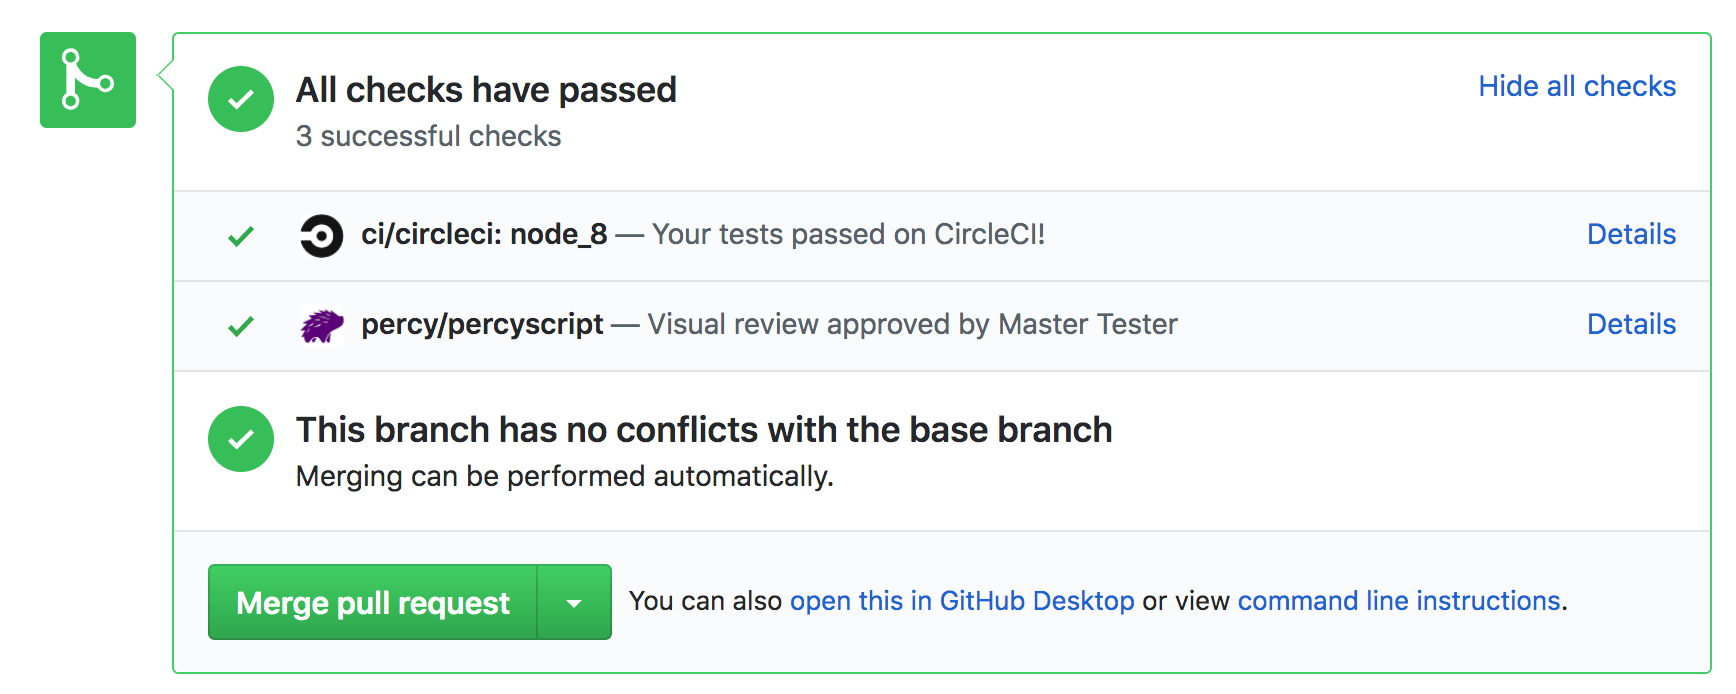
That’s it! You’re ready to merge with confidence that every part of your app looks exactly like it should.
而已! 您已经准备好充满信心地合并应用程序的每个部分,使其看起来完全一样。
We hope this tutorial has helped you get acquainted with Percy’s visual review platform and workflow. To continue learning about how Percy works, feel free to check out these additional resources:
我们希望本教程可以帮助您熟悉Percy的视觉检查平台和工作流程。 要继续了解Percy的工作原理,请随时查看以下其他资源:
- Getting started with Percy Percy入门
- Percy platform basics Percy平台基础知识
- Visual testing basics 视觉测试基础
- Percy SDKs Percy SDK
This content is sponsored via Syndicate Ads.
此内容是通过Syndicate Ads 赞助的 。
Happy testing! 💜
测试愉快! 💜
翻译自: https://scotch.io/tutorials/getting-started-with-visual-testing-in-5-minutes
视觉测试


 1044
1044

 被折叠的 条评论
为什么被折叠?
被折叠的 条评论
为什么被折叠?
 到【灌水乐园】发言


