


遥感软件
As part of my fellowship with the Software Sustainability Institute, I’ve written an article on Software Sustainability in Remote Sensing. This article was originally written a couple of years ago and it never quite got around to being published. However, I have recently updated it, and it’s now been posted on the SSI’s blog. I’ve also ‘reblogged it’ below: it is a long read, but hopefully you’ll agree that it is worth it.
作为我与软件可持续发展研究所合作的一部分,我写了一篇有关遥感软件可持续性的文章。 这篇文章最初是几年前写的,至今还没有完全发表。 但是,我最近对其进行了更新,并且现在已将其发布在SSI的博客上 。 我也在下面“重新发送了邮件”:读了很长的书,但是希望您会同意它是值得的。
If anyone reading this is also interested in software sustainability in remote sensing, and identifies with some of the issues raised below then please get in touch! I’d love to discuss it with you and see what we can do to improve things.
如果任何人也对遥感软件的可持续性感兴趣,并确定以下提出的一些问题,请联系! 我很乐意与您讨论,看看我们可以做些什么来改进。
1. What is remote sensing?
1.什么是遥感?
Remote sensing broadly refers to the acquisition of information about an object remotely (that is, with no physical contact). The academic field of remote sensing, however, is generally focused on acquiring information about the Earth (or other planetary bodies) using measurements of electromagnetic radiation taken from airborne or satellite sensors. These measurements are usually acquired in the form of large images, often containing measurements in a number of different parts of the electromagnetic spectrum (for example, in the blue, green, red and near-infrared), known as wavebands. These images can be processed to generate a huge range of useful information including land cover, elevation, crop health, air quality, CO2 levels, rock type and more, which can be mapped easily over large areas. These measurements are now widely used operationally for everything from climate change assessments (IPCC, 2007) to monitoring the destruction of villages in Darfur (Marx and Loboda, 2013) and the deforestation of the Amazon rainforest (Kerr and Ostrovsky, 2003).
遥感广义上是指远程(即没有物理接触)获取有关对象的信息。 但是,遥感的学术领域通常集中在使用从机载或卫星传感器获取的电磁辐射的测量值来获取有关地球(或其他行星体)的信息。 这些测量值通常以大图像的形式获取,通常包含电磁波谱的多个不同部分(例如,蓝,绿,红和近红外)的测量值,也就是波段。 可以对这些图像进行处理,以生成范围广泛的有用信息,包括土地覆盖,海拔,作物健康,空气质量,CO 2水平,岩石类型等,这些信息可以轻松地在大面积上绘制。 从气候变化评估(IPCC,2007年)到监测达尔富尔村庄的破坏(Marx和Loboda,2013年)和亚马逊雨林的砍伐(Kerr和Ostrovsky,2003年),这些测量结果现已广泛用于所有操作。
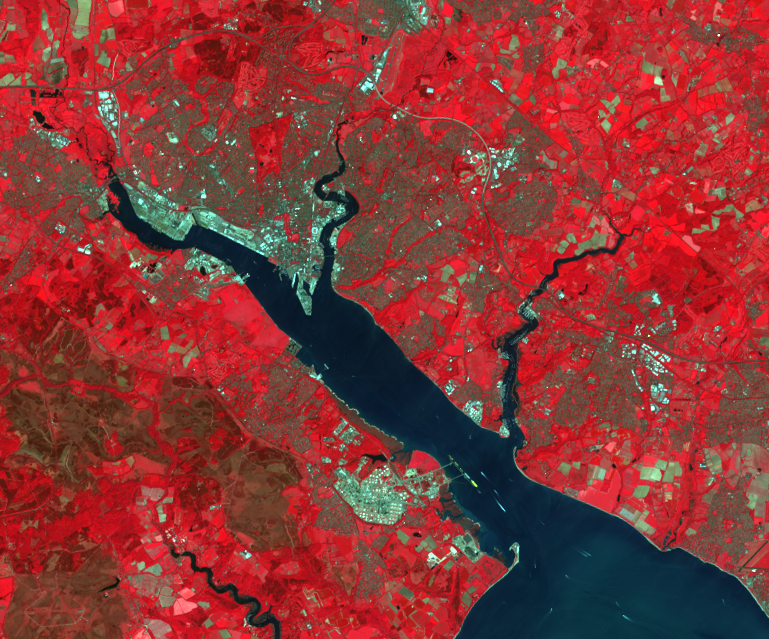
Figure 1: Landsat 8 image of Southampton, UK shown as a false-colour composite using the Near-Infrared, Red and Green bands. Vegetation is bright red, heathland and bare ground is beige/brown, urban areas are light blue, and water is dark blue.
图1:英国南安普敦的Landsat 8图像,显示为使用近红外,红色和绿色波段的伪彩色合成物。 植被是鲜红色的,荒地和裸露的地面是米色/棕色,市区是浅蓝色,水是深蓝色。
The field, which crosses the traditional disciplines of physics, computing, environmental science and geography, developed out of air photo interpretation work during World War II, and expanded rapidly during the early parts of the space age. The launch of the first Landsat satellite in 1972 provided high-resolution images of the majority of the Earth for the first time, producing repeat images of the same location every 16 days at a resolution of 60m. In this case, the resolution refers to the level of detail, with a 60m resolution image containing measurements for each 60x60m area on the ground. Since then, many hundreds of further Earth Observation satellites have been launched which take measurements in wavelengths from ultra-violet to microwave at resolutions ranging from 50km to 40cm. One of the most recent launches is that of Landsat 8, which will contribute more data to an unbroken record of images from similar sensors acquired since 1972, now at a resolution of 30m and with far higher quality sensors. The entire Landsat image archive is now freely available to everyone – as are many other images from organisations such as NASA and ESA – a far cry from the days when a single Landsat image cost several thousands of dollars.
该领域跨越了物理学,计算机,环境科学和地理学的传统学科,在第二次世界大战期间从空中照片解释工作发展而来,并在太空时代初期Swift发展。 1972年发射的第一颗Landsat卫星首次提供了地球大部分区域的高分辨率图像,每16天以60m的分辨率产生相同位置的重复图像。 在这种情况下,分辨率是指细节水平,其中60m分辨率图像包含地面上每个60x60m区域的测量值。 此后,又发射了数百颗地球观测卫星,这些卫星以从50 km到40 cm的分辨率测量从紫外线到微波的波长。 最近发射的卫星之一是Landsat 8,它将为自1972年以来获取的类似传感器的图像连续记录贡献更多数据,现在的分辨率为30m,并且传感器质量更高。 现在,每个人都可以免费使用整个Landsat图像档案库,就像NASA和ESA等组织的许多其他图像一样,与单个Landsat图像要花费数千美元的时代相去甚远。
2. You have to use software
2.您必须使用软件
Given that remotely sensed data are nearly always provided as digital images, it is essential to use software to process them. This was often difficult with the limited storage and processing capabilities of computers in the 1960s and 1970s – indeed, the Corona series of spy satellites operated by the United States from 1959 to 1972 used photographic film which was then sent back to Earth in a specialised ‘re-entry vehicle’ and then developed and processed like standard holiday photos!
鉴于遥感数据几乎总是以数字图像形式提供,因此必须使用软件对其进行处理。 由于1960年代和1970年代计算机的有限存储和处理能力,通常很难做到这一点–实际上,美国从1959年至1972年运营的Corona系列间谍卫星使用照相胶片,然后将照相胶片专门送回地球。重新进入车辆”,然后像标准的假日照片一样进行开发和处理!
However, all civilian remote-sensing programs transmitted their data to ground stations on Earth in the form of digital images, which then required processing by both the satellite operators (to perform some rudimentary geometric and radiometric correction of the data) and the end-users (to perform whatever analysis they wanted from the images).
但是,所有民用遥感程序都以数字图像的形式将其数据传输到地球上的地面站,然后需要卫星运营商(对数据进行一些基本的几何和辐射校正)和最终用户进行处理(以执行他们想要从图像中进行的任何分析)。
In the early days of remote sensing, computers didn’t even have the ability to display images onscreen, and the available software was very limited (see Figure 2a). Nowadays remote sensing researchers use a wide range of proprietary and open-source software, which can be split into four main categories:
在遥感的早期,计算机甚至没有能力在屏幕上显示图像,并且可用软件非常有限(请参见图2a)。 如今,遥感研究人员使用各种专有和开源软件,这些软件可以分为四个主要类别:
- Specialist remote-sensing image processing software, such as ENVI, Erdas IMAGINE, eCogniton, Opticks and Monteverdi
- Geographical Information System software which provides some remote-sensing processing functionality, such as ArcGIS, IDRISI, QGIS and GRASS
- Other specialist remote-sensing software, such as SAMS for processing spectral data, SPECCHIO for storing spectral data with metadata, DART (Gastellu-Etchegorry et al., 1996) for simulating satellite images and many numerical models including 6S (Vermote et al., 1997), PROSPECT and SAIL (Jacquemoud, 1993).
- General scientific software, including numerical data processing tools, statistical packages and plotting packages.
- 专业遥感图像处理软件,例如ENVI,Erdas IMAGINE,eCogniton,Opticks和Monteverdi
- 地理信息系统软件,可提供一些遥感处理功能,例如ArcGIS,IDRISI,QGIS和GRASS
- 其他专业的遥感软件,例如用于处理光谱数据的SAMS,用于存储具有元数据的光谱数据的SPECCHIO,用于模拟卫星图像的DART(Gastellu-Etchegorry等,1996)和许多数字模型,包括6S(Vermote等, 1997年),展望和航行(雅克穆德,1993年)。
- 通用科学软件,包括数值数据处理工具,统计软件包和绘图软件包。

|

|
Figure 2: Remote sensing image processing in the early 1970s (a) and 2013 (b). The 1970s image shows a set of punched cards and an ‘ASCII-art’ printout of a Landsat image of Southern Italy, produced by E. J. Milton as part of his PhD. The 2013 image shows the ENVI software viewing a Landsat 8 image of Southampton on a Windows PC
图2: 1970年代早期(a)和2013(b)的遥感图像处理。 1970年代的图像显示了一组打Kong卡和意大利南部的Landsat图像的“ ASCII艺术”打印输出,该图像由EJ Milton作为其博士学位的一部分制作。 2013年的图像显示了ENVI软件在Windows PC上查看南安普敦的Landsat 8图像
I surveyed approximately forty people at the Remote Sensing and Photogrammetry Society’s Annual Student Meeting 2013 to find out how they used software in their research, and this produced a list of
 最低0.47元/天 解锁文章


 6414
6414


 被折叠的 条评论
为什么被折叠?
被折叠的 条评论
为什么被折叠?
 到【灌水乐园】发言


