python数据分析和预测
如果您完成了第1部分 ,那么恭喜! 您有耐心格式化数据。 在那篇文章中,我使用了一些Python库和一些基本的足球知识来清理我的国家橄榄球联盟数据集 。 从我离开的地方开始,是时候仔细看看我的数据集了。
数据分析
我将创建一个仅包含要使用的数据字段的最终数据框。 这些主要是除向下和距离(aka yardsToGo )外,我在转换列时创建的数据字段。
     df_final

     = df

     [

     [

     'down'

     ,

     'yardsToGo'

     ,

     'yardsToEndzone'

     ,

     'rb_count'

     ,

     'te_count'

     ,

     'wr_count'

     ,

     'ol_count'

     ,


     'db_count'

     ,

     'secondsLeftInHalf'

     ,

     'half'

     ,

     'numericPlayType'

     ,

     'numericFormation'

     ,

     'play_type'

     ]

     ]
现在,我想使用dataframe.describe()来检查我的数据。 它可以对数据框中的数据进行汇总,从而更容易发现任何异常值。
print ( df_final. describe ( include = 'all' ) )

除了yardsToEndzone的计数比其余各列的计数低之外,大多数内容看起来都不错。 dataframe.describe()文档将计数返回值定义为“非NA /空观测值的数量”。 我需要检查我是否有空的码线值。
print ( df. yardlineNumber . unique ( ) )
为什么会有nan值? 为什么我似乎缺少一条50码的线? 如果我不了解,我会说我从NFL转储中得到的未稀释数据实际上并没有使用50码线作为值,而是将其标记为nan。
以下是一些码数为NA的比赛的比赛描述:

看来我的假设是正确的。 每个比赛描述的结束码和获得的码数均为50。完美(为什么?!)。 我将从上次在yards_to_endzone函数之前添加一行来将这些nan值映射到50。
df [ 'yardlineNumber' ] = df [ 'yardlineNumber' ] . fillna ( 50 )
再次运行df_final.describe() ,我现在全面获得了统一计数。 谁知道如此大量的实践只是在研究数据? 当它带有神秘感时,我会更喜欢它。
是时候开始我的可视化了。 Seaborn是一个有用的用于绘制数据的库,我已经在第1部分中将其导入。
播放类型
完整数据集中有多少场传球和奔跑?
     sns.

     catplot

     ( x

     =

     'play_type'

     , kind

     =

     'count'

     , data

     = df_final

     , orient

     =

     'h'

     )


plt.

     show

     (

     )
看起来传球比奔跑的游戏多出1000多个。 这很重要,因为这意味着两种播放类型之间的分配不是50/50的分配。 默认情况下,每个分组的传球次数应比跑步次数多一些。
丘陵
失败是指球队可以尝试比赛的时期。 在NFL中,进攻要经过四次尝试(称为“下降”)才能获得指定的码数(通常从10码开始)。 如果没有,则必须将球传给对手。 是否有特定的下降趋势,往往会有更多的传球或奔跑(也称为奔跑)?
     sns.

     catplot

     ( x

     =

     "down"

     , kind

     =

     "count"

     , hue

     =

     'play_type'

     , data

     = df_final

     )

     ;


plt.

     show

     (

     )
第三局比传球要多得多,但考虑到初始数据的分布,这可能毫无意义。
回归
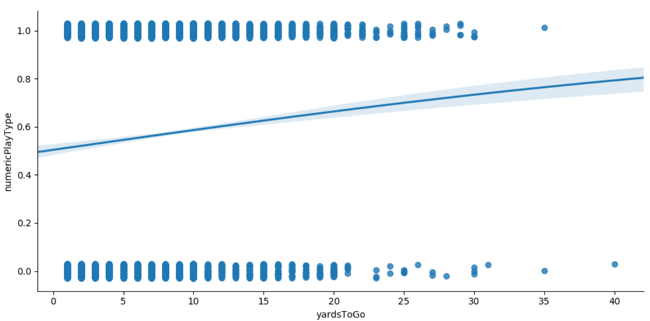
我可以使用numericPlayType列来发挥自己的优势,并创建一个回归图以查看是否存在任何趋势。
     sns.

     lmplot

     ( x

     =

     "yardsToGo"

     , y

     =

     "numericPlayType"

     , data

     = df_final

     , y_jitter

     =

     .03

     , logistic

     =

     True

     , aspect

     =

     2

     )

     ;


plt.

     show

     (

     )

这是一个基本的回归图,表示走的码数越大,数字游戏类型就越大。 如果播放类型为0进行奔跑,传递类型为1进行传球,则这意味着要覆盖的距离越远,该播放就越可能成为传递类型。
模型训练
我将使用XGBoost进行培训; 它要求输入数据必须全部为数字(因此,我必须删除可视化中使用的play_type列)。 我还需要将数据分为训练,验证和测试子集。
     train_df

     , validation_df

     , test_df

     = np.

     split

     ( df_final.

     sample

     ( frac

     =

     1

     )

     ,

     [

     int

     (

     0.7 *

     len

     ( df

     )

     )

     ,

     int

     (

     0.9 *

     len

     ( df

     )

     )

     ]

     )


     print

     (

     "Training size is %d, validation size is %d, test size is %d" %

     (

     len

     ( train_df

     )

     ,


     len

     ( validation_df

     )

     ,


     len

     ( test_df

     )

     )

     )
XGBoost采用特定的数据结构格式的数据,我可以使用DMatrix函数创建该格式 。 基本上,我将numericalPlayType声明为要预测的标签,因此我将向该数据集提供没有该列的干净数据集。
     train_clean_df

     = train_df.

     drop

     ( columns

     =

     [

     'numericPlayType'

     ]

     )


d_train

     = xgb.

     DMatrix

     ( train_clean_df

     , label

     = train_df

     [

     'numericPlayType'

     ]

     ,


                      feature_names

     =

     list

     ( train_clean_df

     )

     )


val_clean_df

     = validation_df.

     drop

     ( columns

     =

     [

     'numericPlayType'

     ]

     )


d_val

     = xgb.

     DMatrix

     ( val_clean_df

     , label

     = validation_df

     [

     'numericPlayType'

     ]

     ,


                    feature_names

     =

     list

     ( val_clean_df

     )

     )


eval_list

     =

     [

     ( d_train

     ,

     'train'

     )

     ,

     ( d_val

     ,

     'eval'

     )

     ]


results

     =

     {

     }
其余设置需要一些参数调整。 不必太草率 ,预测运行/通过是一个二进制问题,我应该将目标设置为binary.logistic 。 有关XGBoost所有参数的更多信息,请参阅其文档 。
     param

     =

     {


     'objective' :

     'binary:logistic'

     ,


     'eval_metric' :

     'auc'

     ,


     'max_depth' :

     5

     ,


     'eta' :

     0.2

     ,


     'rate_drop' :

     0.2

     ,


     'min_child_weight' :

     6

     ,


     'gamma' :

     4

     ,


     'subsample' :

     0.8

     ,


     'alpha' :

     0.1


     }
针对我的PC的一些侮辱性侮辱,以及后来的两部分系列( Python的哭泣 ),我正式准备训练我的模型! 我将尽早停止一轮,这意味着如果模型训练的评估指标在八轮之后下降,我将结束训练。 这有助于防止过度拟合 。 预测结果表示为结果为1(传球)的概率。
     num_round

     =

     250


xgb_model

     = xgb.

     train

     ( param

     , d_train

     , num_round

     , eval_list

     , early_stopping_rounds

     =

     8

     , evals_result

     = results

     )


test_clean_df

     = test_df.

     drop

     ( columns

     =

     [

     'numericPlayType'

     ]

     )


d_test

     = xgb.

     DMatrix

     ( test_clean_df

     , label

     = test_df

     [

     'numericPlayType'

     ]

     ,


                     feature_names

     =

     list

     ( test_clean_df

     )

     )


actual

     = test_df

     [

     'numericPlayType'

     ]


predictions

     = xgb_model.

     predict

     ( d_test

     )


     print

     ( predictions

     [ :

     5

     ]

     )
我想看看我的模型使用四舍五入的预测(到0或1)和scikit-learn的指标包的准确性。
     rounded_predictions

     = np.

     round

     ( predictions

     )


accuracy

     = metrics.

     accuracy_score

     ( actual

     , rounded_predictions

     )


     print

     (

     "Metrics: \n Accuracy: %.4f" %

     ( accuracy

     )

     )
使用Python及其丰富的库和模型,我可以合理地预测播放类型的结果。 但是,仍有一些我没有考虑的因素。 国防人员对比赛类型有什么影响? 比赛时的得分差异如何? 我想总是有空间检查您的数据并进行改进。 las,这就是程序员变成数据科学家的生活。 是时候考虑提前退休了。
翻译自: https://opensource.com/article/19/10/predicting-nfl-plays-python
python数据分析和预测


 7055
7055


 被折叠的 条评论
为什么被折叠?


