


There are a lot of Linux server monitoring tools in the wild. They have strong and weak sides against others. To get more about Linux server monitoring dstat can be used.
野外有很多Linux服务器监视工具。 他们对他人有强硬的一面。 要获得有关Linux服务器监视的更多信息,可以使用dstat。
Features of dstat are joining information from tools like vmstat, netstat, mpstat, displaying statistics simultaneously, list ordering, exporting to CSV.
dstat的功能包括从vmstat,netstat,mpstat之类的工具加入信息,同时显示统计信息,列表排序,导出为CSV。
如何在Linux中安装dstat (How to Install dstat in Linux)
dstat can be get from official ditributions repositories. In this tutorial we will use fedora but Ubuntu, Debian has same operations too.
dstat可以从官方发行资料存储库获得。 在本教程中,我们将使用fedora,但Ubuntu,Debian也具有相同的操作。
$ sudo dnf install dstat -y
Installing is fast because it is small as 197k.
安装速度很快,因为它只有197k。
dstat帮助 (dstat Help)
Quick help can be get with the -h parameter to the dstat command
可以使用dstat命令的-h参数获得快速帮助
$ dstat -h
Usage: dstat [-afv] [options..] [delay [count]]
Versatile tool for generating system resource statistics

Dstat options:
  -c, --cpu                enable cpu stats
     -C 0,3,total             include cpu0, cpu3 and total
  -d, --disk               enable disk stats
     -D total,hda             include hda and total
  -g, --page               enable page stats
  -i, --int                enable interrupt stats
     -I 5,eth2                include int5 and interrupt used by eth2
  -l, --load               enable load stats
  -m, --mem                enable memory stats
  -n, --net                enable network stats
     -N eth1,total            include eth1 and total
  -p, --proc               enable process stats
  -r, --io                 enable io stats (I/O requests completed)
  -s, --swap               enable swap stats
     -S swap1,total           include swap1 and total
  -t, --time               enable time/date output
  -T, --epoch              enable time counter (seconds since epoch)
  -y, --sys                enable system stats

  --aio                    enable aio stats
  --fs, --filesystem       enable fs stats
  --ipc                    enable ipc stats
  --lock                   enable lock stats
  --raw                    enable raw stats
  --socket                 enable socket stats
  --tcp                    enable tcp stats
  --udp                    enable udp stats
  --unix                   enable unix stats
  --vm                     enable vm stats
  --vm-adv                 enable advanced vm stats
  --zones                  enable zoneinfo stats

  --list                   list all available plugins
  --plugin                 enable external plugin by name (see --list)

  -a, --all                equals -cdngy (default)
  -f, --full               automatically expand -C, -D, -I, -N and -S lists
  -v, --vmstat             equals -pmgdsc -D total

  --bits                   force bits for values expressed in bytes
  --float                  force float values on screen
  --integer                force integer values on screen

  --bw, --black-on-white   change colors for white background terminal
  --color                  force colors
  --nocolor                disable colors
  --noheaders              disable repetitive headers
  --noupdate               disable intermediate updates
  --output file            write CSV output to file
  --profile                show profiling statistics when exiting dstat

delay is the delay in seconds between each update (default: 1)
count is the number of updates to display before exiting (default: unlimited)
运行dstat (Running dstat)
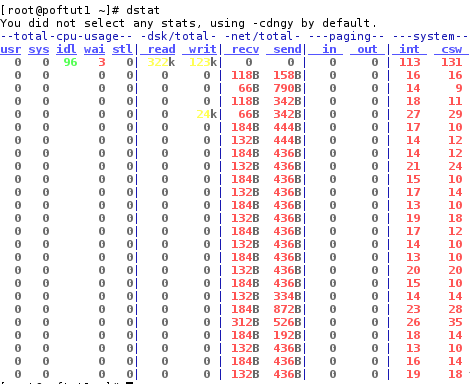
Running dstat without arguments gives we total cpu usage, dsk read/write, network send/receive, paging and interrupts.
在不带参数的情况下运行dstat可以使我们获得总的CPU使用率,dsk的读/写,网络发送/接收,分页和中断。
$ dstat
使用dstat获取内存相关信息 (Getting Memory Related Info with dstat)
By providing --vmstat argument we can get information about memory related used, buffer, cache, read/write information like below.
通过提供--vmstat参数,我们可以获取有关已使用的内存,缓冲区,缓存,读/写信息的信息,如下所示。
[[email protected] ~]# dstat --vmstat
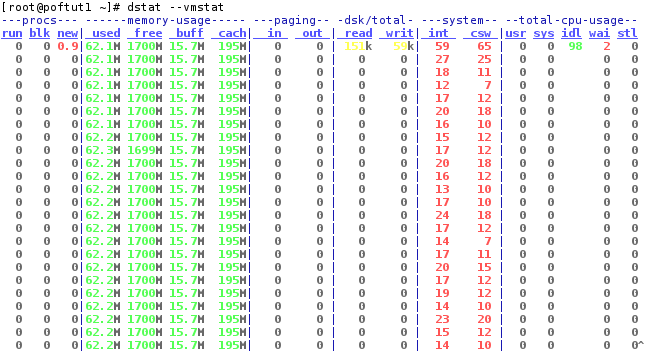
As you see memory usage is very low and about 62M.
如您所见,内存使用率非常低,大约为62M。
使用dstat获取顶级进程 (Get Top Process with dstat)
dstat can get top process and memory using application with --top-cpu and --top-mem parameters.
使用带有--top-cpu和--top-mem参数的应用程序,dstat可以获取顶级进程和内存。
$ dstat -c --top-cpu -dn --top-mem
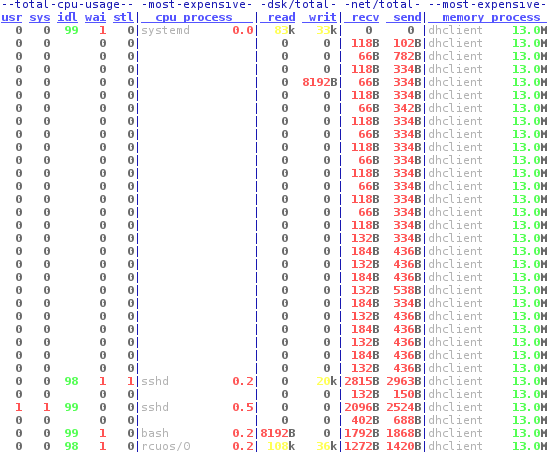
As you see top CPU changes over time. Null entry means that dstat is top process.
如您所见,最高的CPU随时间变化。 空条目表示dstat是顶级进程。
从dstat导出到CSV(Export From dstat to Csv)
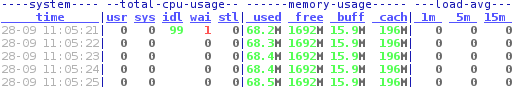
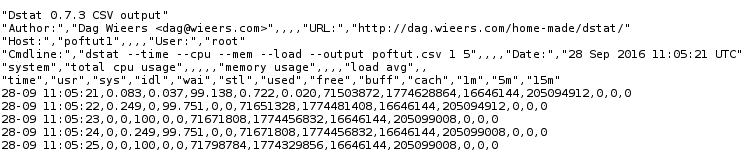
dstat entries can be exported to the CSV or similar formats. Here is an example that exports 5 entries in 1 second interval into poftut.csv
dstat条目可以导出为CSV或类似格式。 这是一个以1秒为间隔将5个条目导出到poftut.csv的示例
$ dstat --time --cpu --mem --load --output poftut.csv 1 5
$ less poftut.csv
列出dstat插件 (List dstat Plugins)
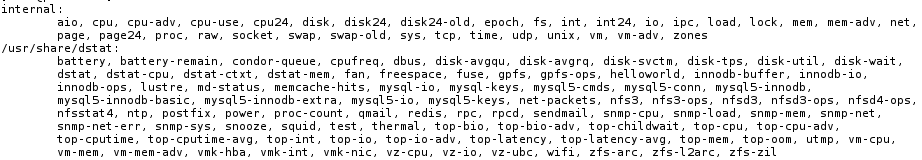
dstat has a lot of plugins to use like nfs, sm rpc info. To get full list use --list parameter.
dstat有很多插件可以使用,例如nfs,sm rpc信息。 要获取完整列表,请使用--list参数。
$ dstat --list
Dstat-监控Linux服务器性能信息图(Dstat- Monitor Linux Server Performance Infographic)

翻译自: https://www.poftut.com/dstat-monitor-linux-server-performance/


 3463
3463


 被折叠的 条评论
为什么被折叠?
被折叠的 条评论
为什么被折叠?
 到【灌水乐园】发言


