


linux vmstat
Linux distributions provides a lot of tools in order to monitor system performance. vmstat is one of the most used tool for system performance monitoring. vmstat can collect and report information about memory, cpu, swap, io in a detailed way. In this tutorial we will examine the output of the vmstat and different features and options of it.
Linux发行版提供了许多工具来监视系统性能。 vmstat是用于系统性能监视的最常用的工具之一。 vmstat可以详细收集和报告有关内存,cpu,swap,io的信息。 在本教程中,我们将检查vmstat的输出以及它的不同功能和选项。
列出系统资源使用情况 (List System Resource Usage)
We will start by using vmstat command without any option. This will list general statistics and information about system resource usage.
我们将首先使用不带任何选项的vmstat命令。 这将列出常规统计信息和有关系统资源使用情况的信息。
$ vmstat
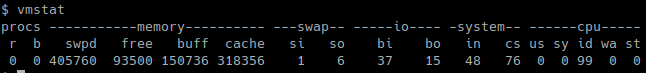
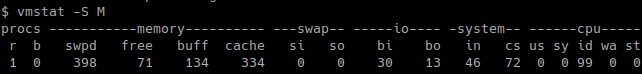
We can see that there is 5 main column.
我们可以看到有5个主要列。
procsdisplay information about processes.procs显示有关进程的信息。memorydisplay information about memory metricsmemory显示有关内存指标的信息swpdprovides avaible swap sizeswpd提供可用的交换大小freeprovides unused memory sizefree提供未使用的内存大小buffprovides buffered memory sizebuff提供缓冲的内存大小cacheprovides cached memory sizecache提供缓存的内存大小
memorydisplay information about memory metricsmemory显示有关内存指标的信息swapprovides swap related information but in these days it is not used so much.swap提供了与交换有关的信息,但是在最近的日子里,它使用的很少。ioprovides disk related informatinio提供磁盘相关信息biblock input shows data block count read from block devicesbi块输入显示从块设备读取的数据块计数boblock output shows block count sent to block devicesbo块输出显示发送到块设备的块计数
ioprovides disk related informatinio提供磁盘相关信息systemprovides interrup and context switch information which is related with CPUsystem提供与CPU相关的中断和上下文切换信息innumber of interrupts per secondin每秒的中断数csnumber of context switches per secondcs上下文的数目每秒切换
systemprovides interrup and context switch information which is related with CPUsystem提供与CPU相关的中断和上下文切换信息cpuprovides CPU usage informationcpu提供CPU使用率信息ustime spent user space operations or user timeus花费在用户空间操作或用户时间上的时间idtime spent idleid时间花在闲置sytime spent system operationssy运行所花的时间watime spent waiting for IO.wa时间花在等待IO。sttime spent from virtual machinest时间从虚拟机花
cpuprovides CPU usage informationcpu提供CPU使用率信息
以指定间隔交互式打印输出(Print Output At Specified Interval Interactively)
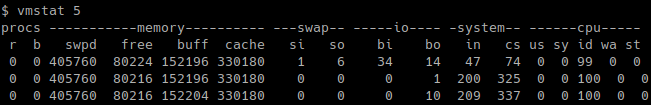
By default vmstat command is non interactive. It will print information just one time after called and then quit. If we need to it continuously and print command output at given intervals we need to provide the interval as seconds after command. We will print at 5 second interval in this example.
默认情况下, vmstat命令是非交互式的。 它将在调用后仅一次打印信息,然后退出。 如果我们连续需要它并以给定的间隔打印命令输出,则需要以命令后的秒数作为间隔。 在此示例中,我们将以5秒的间隔打印。
$ vmstat 5
打印时间戳(Print Timestamp)
As the output printed one or multiple times we may need to know related time. We can print given information time by printing time stamp. We need to provide -t option for this. Time column will be added as last column after cpu column.
当输出打印一次或多次时,我们可能需要知道相关时间。 我们可以通过打印时间戳来打印给定的信息时间。 我们需要为此提供-t选项。 时间列将添加为cpu列之后的最后一列。
$ vmstat -t

列出内存活动和不活动(List Memory Active and Inactive)
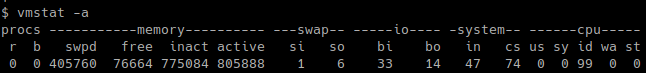
Active memory is part or size of the memory which is actively used currently running processes. Inactive memory is part or size of the memory where died or non existing processes. We will use -a option for active and inactive memory. We can see that memory column provides inact and active columns.
活动内存是当前正在运行的进程正在使用的内存的一部分或大小。 不活动的内存是已死亡或不存在进程的内存的一部分或大小。 我们将-a选项用于活动和非活动内存。 我们可以看到memory列提供了inact和active列。
$ vmstat -a
详细查看磁盘I / O静态信息(View Disk I/O Statics In Detail)
As writing disk and disk topology is a complex area related information can be printed with the -d option. Following information will be provided by this option.
由于写入磁盘和磁盘拓扑是一个复杂区域,因此可以使用-d选项打印相关信息。 此选项将提供以下信息。
$ vmstat -d
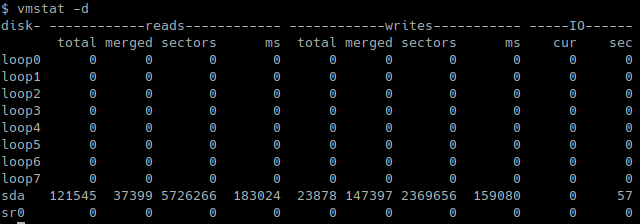
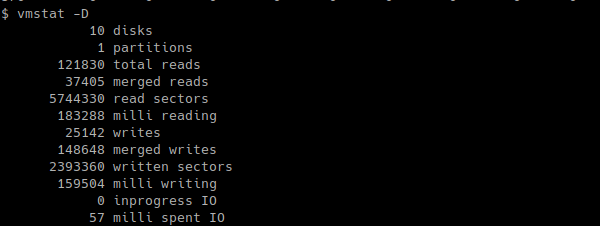
Readsshow read related informationReads显示阅读的相关信息totalshows successfully completed total readtotal显示成功完成的总数读取mergedshows grouped readsmerged显示分组阅读sectorsshows sector readssectors显示部门读取msshows milliseconds spent for readsms显示读取花费的毫秒数
Readsshow read related informationReads显示阅读的相关信息Writesshow write related informationWrites显示写相关信息totalshows successfully completed total readtotal显示成功完成的总数读取mergedshows grouped readsmerged显示分组阅读sectorsshows sector readssectors显示扇区读取msshows milliseconds spent for readsms显示读取花费的毫秒数
Writesshow write related informationWrites显示写相关信息IOshow currently active IO operations informationIO显示当前活动的IO操作信息curI/O in progresscur正在进行I / Osseconds spent for I/OI / O花费的
s秒
IOshow currently active IO operations informationIO显示当前活动的IO操作信息
查看磁盘I / O静态摘要 (View Disk I/O Statics Summary)
We can also print disk related I/O statistics in summary or brief mode with -D option.
我们还可以使用-D选项以摘要或简要模式打印与磁盘相关的I / O统计信息。
$ vmstat -D
用法兆字节(公制)(Usage Megabyte As Metric)
During usage of all options the default metric for memory is byte. This will lower readability. We can make metrics more readable or human readable with -S M option which will set Megabyte as metric.
在使用所有选项期间,默认的内存度量标准是字节。 这将降低可读性。 我们可以使用-SM选项使指标更易读或更易读,从而将兆字节设置为指标。
$ vmstat -S M
列出事件计数器和内存静态信息 (List Event Counters and Memory Statics)
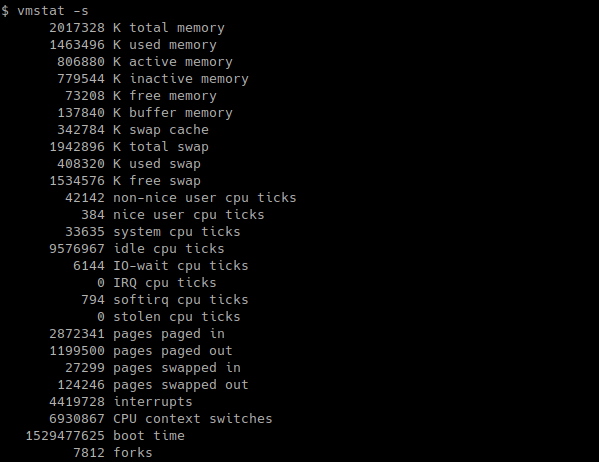
We can use -s option in order to print event counters and memory statistics.
我们可以使用-s选项来打印事件计数器和内存统计信息。
$ vmstat -s
翻译自: https://www.poftut.com/how-to-use-vmstat-to-monitor-linux-performance/
linux vmstat


 2060
2060


 被折叠的 条评论
为什么被折叠?
被折叠的 条评论
为什么被折叠?
 到【灌水乐园】发言


