ES profile 性能优化用——返回各个shard的耗时

Profile API

都说要致富先修路,要调优当然需要先监控啦,elasticsearch在很多层面都提供了stats方便你来监控调优,但是还不够,其实很多情况下查询速度慢很大一部分原因是糟糕的查询引起的,玩过SQL的人都知道,数据库服务的执行计划(execution plan)非常有用,可以看到那些查询走没走索引和执行时间,用来调优,elasticsearch现在提供了Profile API来进行查询的优化,只需要在查询的时候开启profile:true就可以了,一个查询执行过程中的每个组件的性能消耗都能收集到。 
这里写图片描述

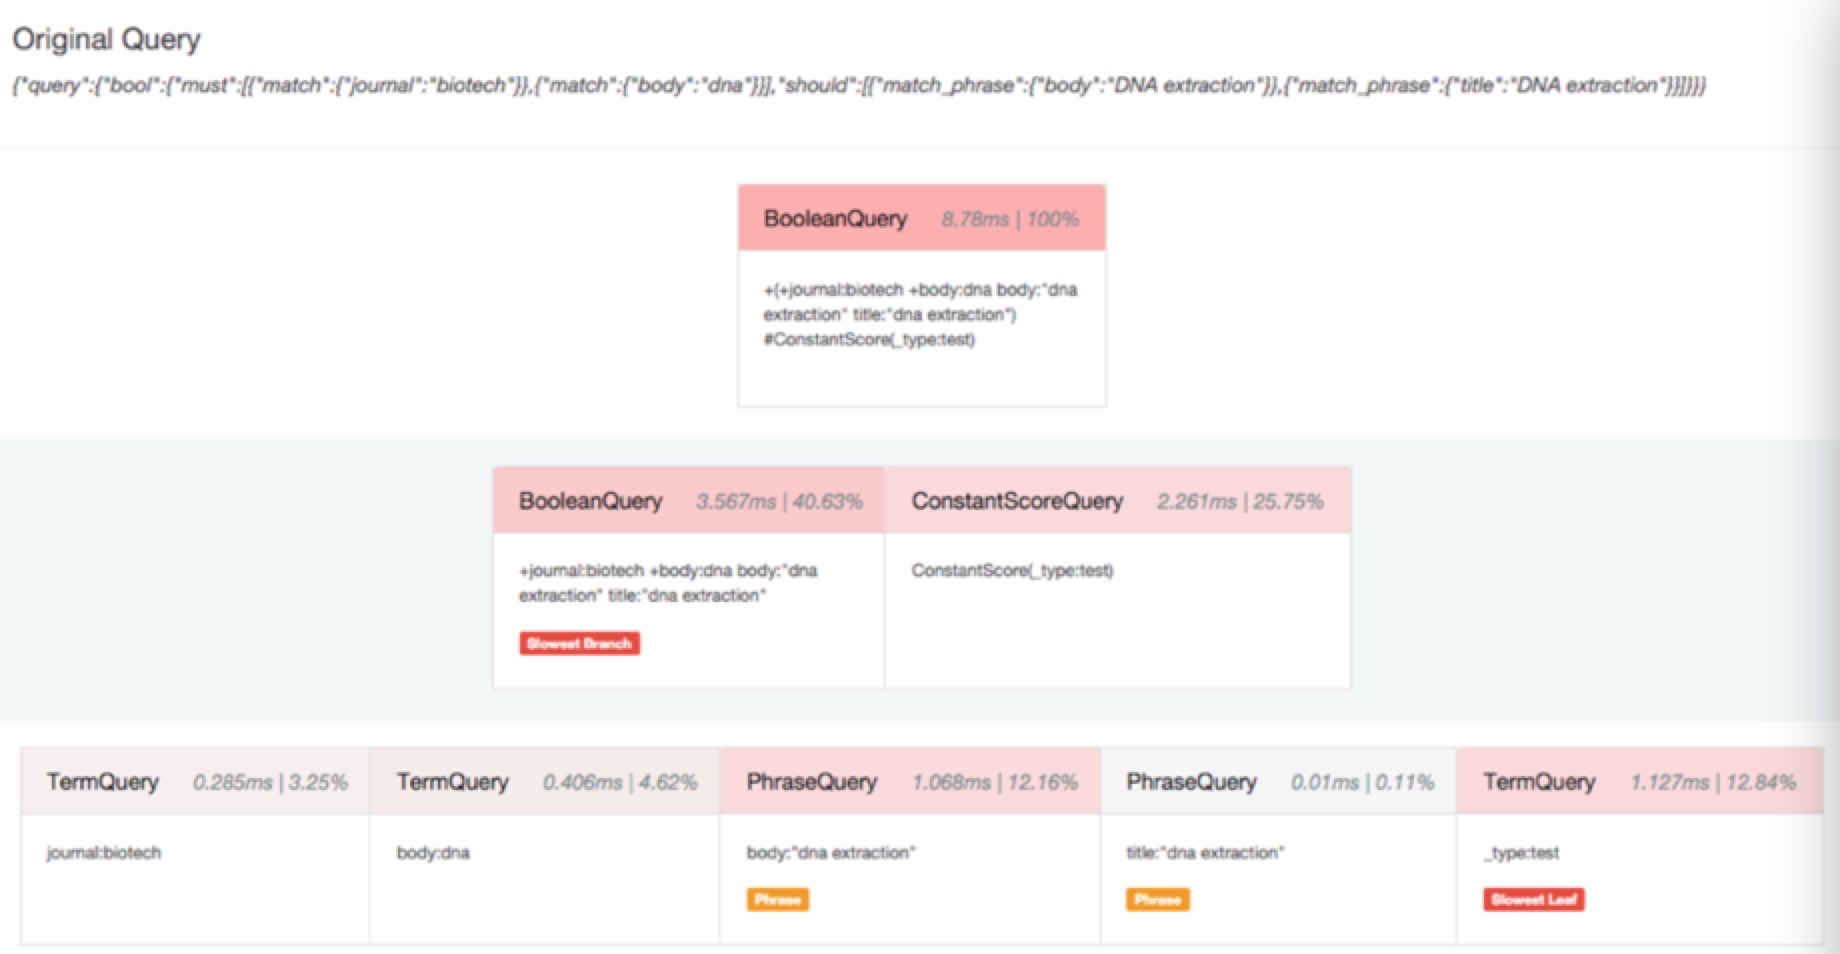
那个子查询耗时多少,占比多少,一目了然,同时支持search和aggregation的profile!

Usage

Any _search request can be profiled by adding a top-level profile parameter:

GET /twitter/_search
{
  "profile": true,
  "query" : {
    "match" : { "message" : "some number" }
  }
}

Setting the top-level profile parameter to true will enable profiling for the search

This will yield the following result:

{
   "took": 25,
   "timed_out": false,
   "_shards": {
      "total": 1,
      "successful": 1,
      "skipped" : 0,
      "failed": 0
   },
   "hits": {
      "total": 4,
      "max_score": 0.5093388,
      "hits": [...] 
   },
   "profile": {
     "shards": [
        {
           "id": "[2aE02wS1R8q_QFnYu6vDVQ][twitter][0]",
           "searches": [
              {
                 "query": [
                    {
                       "type": "BooleanQuery",
                       "description": "message:some message:number",
                       "time_in_nanos": "1873811",
                       "breakdown": {
                          "score": 51306,
                          "score_count": 4,
                          "build_scorer": 2935582,
                          "build_scorer_count": 1,
                          "match": 0,
                          "match_count": 0,
                          "create_weight": 919297,
                          "create_weight_count": 1,
                          "next_doc": 53876,
                          "next_doc_count": 5,
                          "advance": 0,
                          "advance_count": 0
                       },
                       "children": [
                          {
                             "type": "TermQuery",
                             "description": "message:some",
                             "time_in_nanos": "391943",
                             "breakdown": {
                                "score": 28776,
                                "score_count": 4,
                                "build_scorer": 784451,
                                "build_scorer_count": 1,
                                "match": 0,
                                "match_count": 0,
                                "create_weight": 1669564,
                                "create_weight_count": 1,
                                "next_doc": 10111,
                                "next_doc_count": 5,
                                "advance": 0,
                                "advance_count": 0
                             }
                          },
                          {
                             "type": "TermQuery",
                             "description": "message:number",
                             "time_in_nanos": "210682",
                             "breakdown": {
                                "score": 4552,
                                "score_count": 4,
                                "build_scorer": 42602,
                                "build_scorer_count": 1,
                                "match": 0,
                                "match_count": 0,
                                "create_weight": 89323,
                                "create_weight_count": 1,
                                "next_doc": 2852,
                                "next_doc_count": 5,
                                "advance": 0,
                                "advance_count": 0
                             }
                          }
                       ]
                    }
                 ],
                 "rewrite_time": 51443,
                 "collector": [
                    {
                       "name": "CancellableCollector",
                       "reason": "search_cancelled",
                       "time_in_nanos": "304311",
                       "children": [
                         {
                           "name": "SimpleTopScoreDocCollector",
                           "reason": "search_top_hits",
                           "time_in_nanos": "32273"
                         }
                       ]
                    }
                 ]
              }
           ],
           "aggregations": []
        }
     ]
   }
}

Search results are returned, but were omitted here for brevity

Even for a simple query, the response is relatively complicated. Let’s break it down piece-by-piece before moving to more complex examples.

First, the overall structure of the profile response is as follows:

{
   "profile": {
        "shards": [
           {
              "id": "[2aE02wS1R8q_QFnYu6vDVQ][twitter][0]",  
              "searches": [
                 {
                    "query": [...],             
                    "rewrite_time": 51443,      
                    "collector": [...]          
                 }
              ],
              "aggregations": [...]             
           }
        ]
     }
}

A profile is returned for each shard that participated in the response, and is identified by a unique ID

Each profile contains a section which holds details about the query execution

Each profile has a single time representing the cumulative rewrite time

Each profile also contains a section about the Lucene Collectors which run the search

Each profile contains a section which holds the details about the aggregation execution

转载于:https://www.cnblogs.com/bonelee/p/9830676.html

  • 0
    点赞
  • 0
    收藏
    觉得还不错? 一键收藏
  • 0
    评论
Elasticsearch是一个开源的搜索引擎,它被广泛用于数据分析和实时应用的搜索功能。为了优化Elasticsearch的检索性能,我们可以调整以下几个参数。 1. 分片数(Shard):Elasticsearch将索引分成多个分片进行分布式处理,分片数会影响搜索的并行度。较多的分片数可以提高搜索的并行性能,但也会增加集群的资源消耗。因此,需要根据集群的硬件配置和数据量进行合理的设置。 2. 副本数(Replica):副本数决定了每个分片有多少个备份。增加副本数可以提高搜索的可用性和负载均衡的效果,但也会增加索引的写入性能。在高并发读取场景中,合理设置副本数可以提高搜索性能。 3. 查询优化:Elasticsearch提供了丰富的查询功能,可以通过查询DSL、过滤器等方式进行优化。合理的查询优化可以减少网络传输数据的量,提高搜索的效率。 4. 硬件配置:Elasticsearch对硬件的要求较高,包括CPU、内存和磁盘等方面。合理的硬件配置可以提高搜索的性能和并发处理能力。 5. 分片路由策略:Elasticsearch使用哈希算法将文档分配到不同的分片上。通过合理的分片路由策略,可以均衡地分配数据到各个节点上,提高搜索的效率。 除了以上几个参数外,还有一些其他的性能调优技巧,如合理设置缓存、优化网络传输性能、合理设置刷新频率等。需要根据具体的场景和需求进行调优,以达到最佳的搜索性能。

“相关推荐”对你有帮助么?

  • 非常没帮助
  • 没帮助
  • 一般
  • 有帮助
  • 非常有帮助
提交
评论
添加红包

请填写红包祝福语或标题

红包个数最小为10个

红包金额最低5元

当前余额3.43前往充值 >
需支付:10.00
成就一亿技术人!
领取后你会自动成为博主和红包主的粉丝 规则
hope_wisdom
发出的红包
实付
使用余额支付
点击重新获取
扫码支付
钱包余额 0

抵扣说明:

1.余额是钱包充值的虚拟货币,按照1:1的比例进行支付金额的抵扣。
2.余额无法直接购买下载,可以购买VIP、付费专栏及课程。

余额充值