


jax-ws和jax-rs
通常,利用图表提供数据的直观表示很有用。 PrimeFaces提供制图解决方案,可轻松将数据的可视表示形式添加到Web和移动应用程序中。 如果我们将PrimeFaces图表组件的使用与RESTful Web服务数据结合在一起,我们可以创建自定义图表,以适合台式机和移动设备。
在本文中,我将更新Java EE 7动手练习MoviePlex应用程序,以提供一个仪表板,我们可以在其中集成PrimeFaces图表组件。 在本示例中,我们将创建一个图表,但是您可以利用本文帮助您以类似的方式构建更多图表。 具体来说,我们将利用RESTful Web服务收集电影院的容量信息,并使用PrimeFaces条形图显示每个剧院的容量。
首先,下载Java EE 7动手练习应用程序解决方案归档文件 (如果尚未下载)。 从那里,在NetBeans IDE中打开它。 要创建这篇文章,我正在使用NetBeans 8.0.2。 将项目导入NetBeans后,通过右键单击项目并选择“运行”,将其部署到应用程序服务器(在我的情况下为GlasFish 4.1)。 部署完成后,通过打开以下URL在浏览器中打开Theater Web服务:http:// localhost:8080 / ExploringJavaEE7 / webresources / theater /。 该Web服务应产生一个与图1类似的清单。
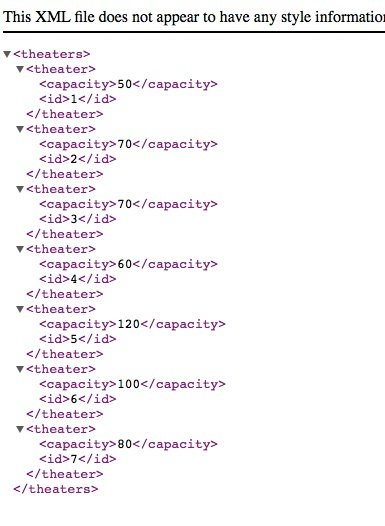
图1:Theater Web Service XML
我们将利用此Web服务中的数据来提供仪表板小部件。 首先创建后端代码,然后处理UI。 首先,通过右键单击Source Packages,然后选择“ New…”->“ Java Packages”,创建一个名为org.glassfish.movieplex7.jsf的新软件包。 接下来,通过右键单击该包并选择“ New…”->“ JSF Managed Bean”,创建一个JSF Managed Bean控制器,并将其命名为DashboardController 。 让我们将控制器注释为@SessionScoped ,然后实现java.io.Serializable 。 在此控制器中,我们将获取数据,并为仪表板构建模型。 我们将首先使用JAX-RS客户端查询Web服务,然后将利用数据填充Theater对象的列表。 因此,我们需要定义以下四个字段来开始:
Client jaxRsClient;
// Typically not hard coded...store in a properties file or database
String baseUri = "http://localhost:8080/ExploringJavaEE7/webresources/theater/";

private List<Theater> theaterList;
private BarChartModel theaterCapacityModel; Client类型为javax.ws.rs.client.Client ,我们将通过调用javax.ws.rs.client.ClientBuilder来初始化类构造函数中的字段,如下所示:
public DashboardController() {
    jaxRsClient = ClientBuilder.newClient();
}
接下来,我们需要创建一种方法来加载数据,创建和配置模型。 在我们的控制器中, init()方法基本上包含将任务委派给其他方法的实现。 init()方法的实现调用两个方法: loadData()和createTheaterCapacityModel() 。
public void init() {
    loadData();

    createTheaterCapacityModel();
}
编写代码是为了方便日后向我们的仪表板添加更多小部件。 loadData()方法提供了将数据从Web服务加载到本地列表中的实现。
private void loadData() {

    theaterList = jaxRsClient.target(baseUri)
            .request("application/xml")
            .get(new GenericType>() {
            }
            );

}
如果我们有更多的小部件,则还将这些数据模型的数据加载代码也添加到此方法中。 接下来,我们需要初始化定义的org.primefaces.model.chart.BarChartModel ,并使用来自Web服务的数据加载它。 initTheaterCapacityModel()方法包含用于创建BarChartModel的实现,并用一个或多个ChartSeries对象填充它以构建数据。
public BarChartModel initTheaterCapacityModel() {

    BarChartModel model = new BarChartModel();

    ChartSeries theaterCapacity = new ChartSeries();
    theaterCapacity.setLabel("Capacities");


    for (Theater theater : theaterList) {

        theaterCapacity.set(theater.getId(), theater.getCapacity());

    }
    model.addSeries(theaterCapacity);

    return model;
} 如您所见,该模型由单个org.primefaces.model.chart.ChartSeries对象组成。 实际上,该模型可以包含多个ChartSeries对象,并且将使用不同的彩色条在图表中显示该数据。 在这种情况下,我们只需将剧院ID和每个Theater对象的容量添加到ChartSeries对象,然后将其添加到BarChartModel 。 在我们的init()方法中调用createTheaterCapacityModel()方法,并在其中调用initTheaterCapacityModel()方法来创建org.primefaces.model.chart.BarChartModel ,然后进行相应配置。
private void createTheaterCapacityModel() {
    theaterCapacityModel = initTheaterCapacityModel();

    theaterCapacityModel.setTitle("Theater Capacity");
    theaterCapacityModel.setLegendPosition("ne");
    theaterCapacityModel.setBarPadding(3);
    theaterCapacityModel.setShadow(false);

    Axis xAxis = theaterCapacityModel.getAxis(AxisType.X);
    xAxis.setLabel("Theater");

    Axis yAxis = theaterCapacityModel.getAxis(AxisType.Y);
    yAxis.setLabel("Capacity");
    yAxis.setMin(0);
    yAxis.setMax(200);

} 如您所见,在方法内部,我们通过调用initTheaterCapacityModel()初始化模型,然后通过一系列“设置”方法对其进行配置。 具体来说,我们设置标题,位置并提供一些视觉配置。 接下来,通过调用模型的getAxis()方法并传递X和Y轴常量来设置轴。 然后,通过为Y轴设置标签和最小/最大值来配置每个轴。 请参阅本文末尾的课程的完整资源。
服务器端代码就是这样做的,现在让我们看一下用于显示图表组件的UI代码。 首先,通过右键单击并选择"New..."-> "XHTML..." ,在项目的Web Pages文件夹的根目录处生成一个新的XHTML文件,并将文件命名为dashboard.xhtml 。 dashboard.xhtml的源应包含以下内容:
<html xmlns:f="http://xmlns.jcp.org/jsf/core" xmlns:h="http://xmlns.jcp.org/jsf/html" xmlns:p="http://primefaces.org/ui" xmlns="http://www.w3.org/1999/xhtml">
    <h:head>


        <title>Theater Dashboard</title>

    </h:head>
    <h:body>
        <f:event listener="#{dashboardController.initView}" type="preRenderView"/>
        <h:form id="theaterDash" prependid="false">
            <p:growl id="growl" showdetail="true"/>
            <p:layout fullpage="true">
                <p:layoutUnit position="center">

                            <p:panel header="Capacity for Theaters" id="theater_capacity" style="border: 0px;">
                                <p:chart model="#{dashboardController.theaterCapacityModel}" style="border: 0px; height: 200px; width: 500px;" type="bar">
                            </p:chart></p:panel>


                </p:layoutUnit>
            </p:layout>

            <p:poll interval="60" listener="#{dashboardController.pollData}"/>

        </h:form>

    </h:body>
</html>
相当简单,JSF视图包含PrimeFaces布局,包括面板和图表。 在视图顶部附近,使用f:event标记来调用侦听器方法,该方法在DashboardController类中实现,该类identified by initView() 。 出于本示例的目的, p:chart标签是发生魔术的地方。 尽管可以使用其他选项(在http://www.primefaces.org/showcase中访问),但在这种情况下,图表类型设置为“条形”。 该模型设置为#{dashboardController.theaterCapacityModel} ,我们在控制器类中定义,填充和配置了该模型。 然后,我们提供宽度和高度,以使图表很好地显示。 万一数据发生变化(我知道剧院的大小通常不会增加或减少,但是请与我一起去),我们添加了PrimeFaces民意测验组件,调用pollData( )方法,该组件会定期刷新数据。 在这种情况下,数据将每60秒刷新一次。 完成后,图表应如图2所示。
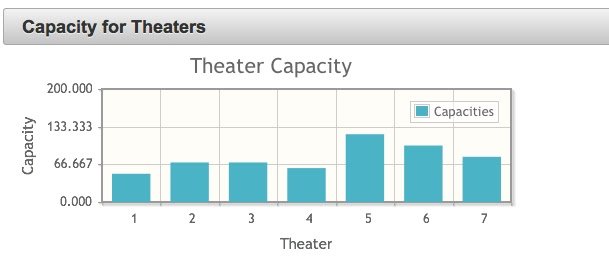
图2:PrimeFaces条形图
图表是交互式的,如果您单击标签,则条形图将被隐藏。 如果您有多个类别(通过ChartSeries ),这将很方便。 您甚至可以在图表组件中包含p:ajax标记,并在单击图表时调用一个动作…也许会弹出一个对话框,以显示有关单击的项目的一些其他数据。 做到了……现在您可以利用PrimeFaces和RESTful Web服务创建更多图表。 我建议在MoviePlex应用程序的基础上构建,以了解还有其他可能性。 DashboardController类的完整源代码:
package org.glassfish.movieplex7.jsf;

import java.util.List;
import javax.inject.Named;
import javax.enterprise.context.SessionScoped;
import javax.faces.component.UIComponent;
import javax.faces.component.UIViewRoot;
import javax.faces.context.FacesContext;
import javax.ws.rs.client.Client;
import javax.ws.rs.client.ClientBuilder;
import javax.ws.rs.core.GenericType;
import org.glassfish.movieplex7.entities.Theater;

import org.primefaces.model.chart.Axis;
import org.primefaces.model.chart.AxisType;
import org.primefaces.model.chart.BarChartModel;
import org.primefaces.model.chart.ChartSeries;

/**
 *
 * @author Juneau
 */
@Named(value = "dashboardController")
@SessionScoped
public class DashboardController implements java.io.Serializable {

    Client jaxRsClient;
    // Typically not hard coded...store in a properties file or database
    String baseUri = "http://localhost:8080/ExploringJavaEE7/webresources/theater/";

    private List theaterList;

    private BarChartModel theaterCapacityModel;


    /**
     * Creates a new instance of FamisEquipPmChartController
     */
    public DashboardController() {
        jaxRsClient = ClientBuilder.newClient();
    }

    public void init() {
        loadData();

        createTheaterCapacityModel();
    }

    /**
     * Initializes the view on page render...if we wish to grab a reference
     * to a panel, etc.
     */
    public void initView(){
        UIViewRoot viewRoot =  FacesContext.getCurrentInstance().getViewRoot();
        // Do something
    }

    public void pollData() {
        System.out.println("polling data...");
        loadData();
    }

    /**
     * JAX-RS client to poll the data
     */
    private void loadData() {

        theaterList = jaxRsClient.target(baseUri)
                .request("application/xml")
                .get(new GenericType>() {
                }
                );

    }


    /**
     * Initialize the Bar Chart Model for Displaying PM Estimated Hours by Month
     *
     * @return
     */
    public BarChartModel initTheaterCapacityModel() {

        BarChartModel model = new BarChartModel();

        ChartSeries theaterCapacity = new ChartSeries();
        theaterCapacity.setLabel("Capacities");


        for (Theater theater : theaterList) {

            theaterCapacity.set(theater.getId(), theater.getCapacity());

        }
        model.addSeries(theaterCapacity);

        return model;
    }


    private void createTheaterCapacityModel() {
        theaterCapacityModel = initTheaterCapacityModel();

        theaterCapacityModel.setTitle("Theater Capacity");
        theaterCapacityModel.setLegendPosition("ne");
        theaterCapacityModel.setBarPadding(3);
        theaterCapacityModel.setShadow(false);

        Axis xAxis = theaterCapacityModel.getAxis(AxisType.X);
        xAxis.setLabel("Theater");

        Axis yAxis = theaterCapacityModel.getAxis(AxisType.Y);
        yAxis.setLabel("Capacity");
        yAxis.setMin(0);
        yAxis.setMax(200);

    }

    /**
     * @return the theaterCapacityModel
     */
    public BarChartModel getTheaterCapacityModel() {
        return theaterCapacityModel;
    }

    /**
     * @param theaterCapacityModel the theaterCapacityModel to set
     */
   public void setTheaterCapacityModel(BarChartModel theaterCapacityModel) {
        this.theaterCapacityModel = theaterCapacityModel;
    }


}
翻译自: https://www.javacodegeeks.com/2015/02/restful-charts-with-jax-rs-and-primefaces.html
jax-ws和jax-rs


 1712
1712

 被折叠的 条评论
为什么被折叠?
被折叠的 条评论
为什么被折叠?
 到【灌水乐园】发言


