


TensorFlow 调试器(tfdbg) 是专门为TensorFlow定制的调试器。在训练或推理的过程中能够让你看到流图的内部结构及状态,由于tensorflow的计算图,使用通常的调试器(如pdb)是看不到的。
这个教程展示了怎么样使用tfdbg命令行接口(CLI)工具来调试出现的非数值(nan s)和无穷数值(infs)问题,这是在开发tensorflow程序中经常出现的bug。
用tfdbg包装tensorflow会话(session)
下面将用tensorflow自带的实例:debug_mnist.py来说明。为了在代码中增加调试功能需要增加如下的代码:
-
# Let your BUILD target depend on "//tensorflow/python/debug:debug_py"
-
# (You don't need to worry about the BUILD dependency if you are using a pip
-
# install of open-source TensorFlow.)
-
from tensorflow.python import debug as tf_debug
-
-
sess = tf_debug.LocalCLIDebugWrapperSession(sess)
-
用tf_debug.LocalCLIDebugWrapperSession重新包装一下sess,这个包装器提供如下特性;(2) 允许你自己定义特殊的filters 来监视某个tensor(张量)的值,可以帮助诊断bug。(比如用来监视某个tensor的值是否有无穷值的情况)
debug_mnist.py实例用tfdbg.has_inf_or_nan,简单的判断tensor中是否有非数值值和无穷值。
当然你也可以自定义filter来监视tensor的状态,后面会有例子说明。
tfdbg调试模式训练模型
用调试模式运行tensorflow自带的测试用例:
python -m tensorflow.python.debug.examples.debug_mnist --debug
调试画面如下:
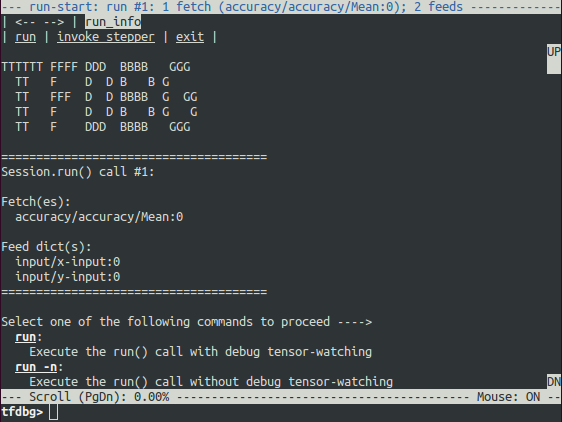
可以使用PageUp / PageDown / Home /End 按键来控制调试屏幕上的内容显示,PageUp /PageDown控制上下滚动,Home /End直接跳到开头和内容的结尾。也可以用鼠标点击UP/DN来查看。
输入run:
run命令使得tfdbg执行到下一次调用Session.run()的地方,然后停下来。在调试窗口将会显示模型使用的数据集,运行时间及使用内存等信息。
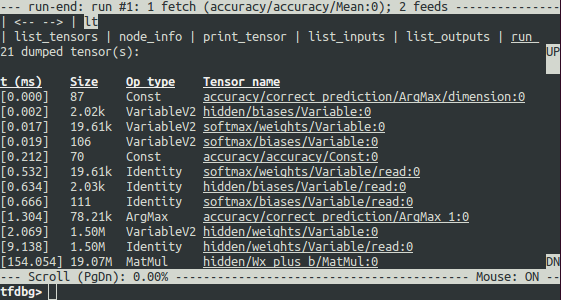
在图运行起来以后,张量列表可以通过执行lt命令呈现。
tfdbg CLI 常用的命令:
(参考代码在目录:tensorflow/python/debug/examples/debug_mnist.py):
| 命令 | 语法和选项 | 说明 | 示例 |
|---|---|---|---|
lt | 列出所有的张量 | lt | |
-n <name_pattern> | 列出和给定张量名字正则表达式相匹配的张量 | lt -n Softmax.* | |
-t <op_pattern> | 列出和给定张量类型正则表达式相匹配的张量 | lt -t MatMul | |
s <sort_key> | 按给定的 sort_key排序张量列表,默认是按时间戳timestamp 排序的,还有其他的sort_key如:dump_size, op_type ,tensor_name. | lt -s dump_size | |
-r | 逆序排序输出张量列表 | lt -r -s dump_size | |
pt | 输出一个张量的值 | ||
pt <tensor> | 输出一个张量的值,中间很多会用省略号表示 | pt hidden/Relu:0 | |
pt <tensor>[slicing] | 使用numpy切片一样的形式来输出张量的片段信息。 | pt hidden/Relu:0[0:50,:] | |
-a | 输出所有的数值,不用省略号表示,这个操作会花费比较长时间。 | pt -a hidden/Relu:0[0:50,:] | |
-r <range> | 高亮显示在-r指定范围内的张量的数值 | pt hidden/Relu:0 -a -r [[-inf,-1],[1,inf]] | |
-s | 在显示结果中添加对张量内容的总结,包括张量的最值,方差,期望。这个命令只能用于数值型的张量,如int*和float*型 | pt -s hidden/Relu:0[0:50,:] | |
@[coordinates] | 控制pt输出特殊的元素 | @[10,0] or @10,0 | |
/regex | 在显示窗口中搜索出给定的表达式 | /inf | |
/ | 显示窗口内容跳转到下一跳/regex命令搜索到的内容 | / | |
pf | 输出一个给Session.run的feed_dict。 | ||
pf <feed_tensor_name> | | pf input_xs:0 | |
| eval | 计算python和numpy表达式的值 | ||
eval <expression> | 计算表达式的值 | eval "np.matmul((`output/Identity:0` / `Softmax:0`).T, `Softmax:0`)" | |
-a | 用python/numpy变量所有的值参与计算,不用省略号表示 | eval -a 'np.sum(`Softmax:0`, axis=1)' | |
ni | 显示节点信息 | ||
-a | 包括节点的输出特性 | ni -a hidden/Relu | |
-d | 输出包括debug的可用信息,如:处理时间 | ni -d hidden/Relu | |
-t | 显示节点创建的函数栈信息 | ni -t hidden/Relu | |
li | 列出节点的输入信息 | ||
-r | 列出节点的输入节点信息(以树形结构显示) | li -r hidden/Relu:0 | |
-d <max_depth> | | li -r -d 3 hidden/Relu:0 | |
-c | 包括控制输入信息 | li -c -r hidden/Relu:0 | |
lo | 列出节点输出的接收节点信息 | ||
-r | 同li | lo -r hidden/Relu:0 | |
-d <max_depth> | t同li | lo -r -d 3 hidden/Relu:0 | |
-c | 包括控制边界内的接收节点 | lo -c -r hidden/Relu:0 | |
ls | 列出涉及节点创建的python源文件 | ||
-p <path_pattern> | 列出与正则表达式匹配的源文件 | ls -p .*debug_mnist.* | |
-n | 列出与按节点名正则表达式匹配的源文件 | ls -n Softmax.* | |
ps | 打印debug的python源文件 | ||
ps <file_path> | 打印source.py源文件代码,并添加每个节点创建的注释信息。 | ps /path/to/source.py | |
-t | 展示源码及张量的信息,而不是默认的节点信息。 | ps -t /path/to/source.py | |
-b <line_number> | 从给定的行开始展示 | ps -b 30 /path/to/source.py | |
-m <max_elements> | 限制每行注释元素的数量 | ps -m 100 /path/to/source.py | |
run | 运行直到下一次 Session.run() | run | |
-n | 无debug运行到下一次Session.run(), 所以不会显示调试信息。 | run -n | |
-t <T> | 无debug运行T-1次session.run(), 最后运行一次debug状态下的session.run(), 运行后进入CLI命令行模式。 | run -t 10 | |
-f <filter_name> | 连续运行sesssion.run()直到某个tensor满足filter的条件,停止运行。 | run -f has_inf_or_nan | |
--node_name_filter <pattern> | 执行下一次session.run(),只观察和正则表达式节点名称相匹配的节点 (和lt命令相似,只是lt是从当前运行的所有结果中匹配,这是在下一次运行中只监视和正则表达式相匹配的节点,可以减少一次运行监视的节点数量) | run --node_name_filter Softmax.* | |
--op_type_filter <pattern> | E执行下一次session.run(),只观察和正则表达式OP类型相匹配的op | run --op_type_filter Variable.* | |
--tensor_dtype_filter <pattern> | 执行下一次session.run(),只观察和正则表达式tensor数据类型相匹配的tensor数据 | run --tensor_dtype_filter int.* | |
-p | 在性能分析模式下执行下一次session.run() | run -p | |
ri | 列出当前运行时,喂数据(feeds)和拿数据(fetchs)的情况 | ri | |
help | 打印帮助信息 | help | |
help <command> | 打印给定命令的帮助信息 | help lt |
可以通过鼠标点击在左上角呈现的<--和-->箭头来切换上一次命令执行的结果页和下一次的结果页。箭头在如下图的位置:
tfdbg CLI的其他特性
- 可以通过上下箭头切换历史命令。
- 查看历史命令的输出结果(只能查看上一个和下一个):
- 使用prev和next命令
- 单击
<--和-->箭头,在屏幕左上角,如上图。
- 也有Tab补全命令的功能
- 可以将某个命令的输出结果重定义输出的文件:例如下面将pt命令的结果重定位输出到
/tmp/xent_value_slices.txtfile:
-
       tfdbg

       >

        pt cross_entropy

       /

       Log

       :

       0

       [:,


       0

       :

       10

       ]


       >


       /tmp/

       xent_value_slices

       .

       txt
-
找 nans 和 infs的bug
为了避免重复的执行run命令在查找nanS和infS的bug,你可以连续运行直到nanS或者infS出现在计算图中的时候。这样做相当于其他调试工具的条件断点。执行如下命令就可以做到类似的条件断点:
tfdbg> run -f has_inf_or_nan
注意: 这个命令执行的条件是has_inf_or_nan这个张量filter已经被注册,当会话创建的时候。filter的定义和注册实例如下:
然后运行:
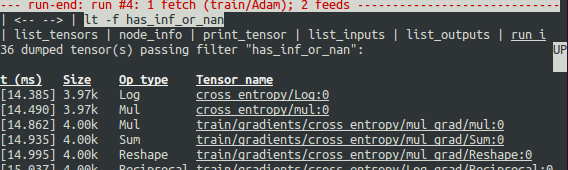
从上图的运行结果可以看出:has_inf_or_nan过滤器被触发的时机是第四次session.run()调用的时候。结果按时间顺序列出了所有出现inf或nan的tensor, 左边显示了他们的时间戳,从图中可以看到第一个出现坏数据的是cross_entropy/Log:0.
查看这个张量的所有数值:
tfdbg> pt cross_entropy/Log:0
可以滚动查看也可以通过下面的命令突出显示无穷值:
tfdbg> /inf
或者
tfdbg> /(inf|nan)
你也可以用以下命令查看这个张量的所有数值类型的概况:
tfdbg> pt -s cross_entropy/Log:0
从总结的概况看,1000个数值中有几个负无穷数值存在。
为什么会导致这些无效数值呢?为了进一步调试,点击cross_entropy/Log的下划线处或者执行下列的命令查看这个节点的信息:
tfdbg> ni cross_entropy/Log
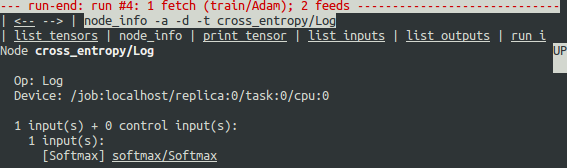
可以看到这个节点的op是Log计算,输入节点是softmax/Softmax。运行下列命令查看其输入节点的值:
tfdbg> pt softmax/Softmax:0
检测是否有0值的情况:
tfdbg> /0\.000
确实有0值的情况,现在清楚的知道节点cross_entropy/Log执行log 0计算得到无效值。 为了查看这个节点对应源码中的位置使用如下命令:
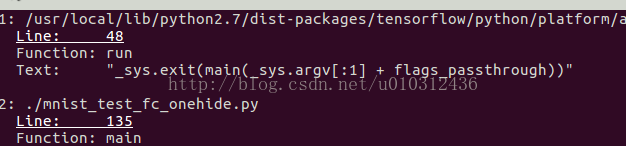
tfdbg> ni -t cross_entropy/Log
如果你单击屏幕顶部的node_info,tfdbg也会自动显示这个节点构造的堆栈信息。
从堆栈信息看,这个节点是在:debug_mnist.py的如下代码出构造的:
diff = y_ * tf.log(y)
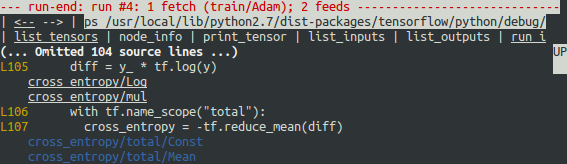
tfdbg调试器可以很容易的跟踪张量和操作在python源文件中的位置。可以单击函数栈信息中有下划线的地方, 如下图:
也可以执行ps /path/to/source.py命令,结果如下示例:
修正问题
编辑 debug_mnist.py, 修改下面内容
diff = -(y_ * tf.log(y))
为python内建的函数:
diff = tf.nn.softmax_cross_entropy_with_logits(labels=y_, logits=logits)
重新debug运行:
python -m tensorflow.python.debug.examples.debug_mnist --debug
在调试界面运行:
run -f has_inf_or_nan`
确认没有张量出现无效值的情况,bug修正成功。
Debugging tf-learn Estimators and Experiments
This section explains how to debug TensorFlow programs that use the EstimatorandExperiment APIs. Part of the convenience provided by these APIs is thatthey manageSessions internally. This makes theLocalCLIDebugWrapperSessiondescribed in the preceding sections inapplicable. Fortunately, you can stilldebug them by using specialhooks provided bytfdbg.
Debugging tf.contrib.learn Estimators
Currently, tfdbg can debug thefit()evaluate()methods of tf-learn Estimators. To debug Estimator.fit(),create aLocalCLIDebugHook and supply it in themonitors argument. For example:
-
# First, let your BUILD target depend on "//tensorflow/python/debug:debug_py"
-
# (You don't need to worry about the BUILD dependency if you are using a pip
-
# install of open-source TensorFlow.)
-
from tensorflow.python import debug as tf_debug
-
-
# Create a LocalCLIDebugHook and use it as a monitor when calling fit().
-
hooks = [tf_debug.LocalCLIDebugHook()]
-
-
classifier.fit(x=training_set.data,
-
y=training_set.target,
-
steps=1000,
-
monitors=hooks)
-
To debug Estimator.evaluate(), assign hooks to the hooks parameter, as inthe following example:
-
accuracy_score = classifier.evaluate(x=test_set.data,
-
y=test_set.target,
-
hooks=hooks)["accuracy"]
-
debug_tflearn_iris.py,based on {$tflearn$tf-learn's iris tutorial}, contains a full example of how touse the tfdbg with Estimators. To run this example, do:
python -m tensorflow.python.debug.examples.debug_tflearn_iris --debug
Debugging tf.contrib.learn Experiments
Experiment is a construct in tf.contrib.learn at a higher level thanEstimator.It provides a single interface for training and evaluating a model. To debugthetrain() andevaluate() calls to anExperiment object, you canuse the keyword argumentstrain_monitors andeval_hooks, respectively, whencalling its constructor. For example:
-
# First, let your BUILD target depend on "//tensorflow/python/debug:debug_py"
-
# (You don't need to worry about the BUILD dependency if you are using a pip
-
# install of open-source TensorFlow.)
-
from tensorflow.python import debug as tf_debug
-
-
hooks = [tf_debug.LocalCLIDebugHook()]
-
-
ex = experiment.Experiment(classifier,
-
train_input_fn=iris_input_fn,
-
eval_input_fn=iris_input_fn,
-
train_steps=FLAGS.train_steps,
-
eval_delay_secs=0,
-
eval_steps=1,
-
train_monitors=hooks,
-
eval_hooks=hooks)
-
-
ex.train()
-
accuracy_score = ex.evaluate()["accuracy"]
-
To build and run the debug_tflearn_iris example in the Experiment mode, do:
python -m tensorflow.python.debug.examples.debug_tflearn_iris \
    --use_experiment --debug
The LocalCLIDebugHook also allows you to configure a watch_fn that can beused to flexibly specify whatTensors to watch on differentSession.run()calls, as a function of thefetches andfeed_dict and other states. Seethis API docfor more details.
Debugging Keras Models with TFDBG
To use TFDBG with Keras, let the Keras backend usea TFDBG-wrapped Session object. For example, to use the CLI wrapper:
-
import tensorflow as tf
-
from keras import backend as keras_backend
-
from tensorflow.python import debug as tf_debug
-
-
keras_backend.set_session(tf_debug.LocalCLIDebugWrapperSession(tf.Session()))
-
-
# Define your keras model, called "model".
-
model.fit(...) # This will break into the TFDBG CLI.
-
Debugging tf-slim with TFDBG
TFDBG currently supports only training withtf-slim.To debug the training process, provideLocalCLIDebugWrapperSession to thesession_wrapper argument ofslim.learning.train(). For example:
-
import tensorflow as tf
-
from tensorflow.python import debug as tf_debug
-
-
# ... Code that creates the graph and the train_op ...
-
tf.contrib.slim.learning_train(
-
train_op,
-
logdir,
-
number_of_steps=10,
-
session_wrapper=tf_debug.LocalCLIDebugWrapperSession)
-
Offline Debugging of Remotely-Running Sessions
Often, your model is running on a remote machine or a process that you don'thave terminal access to. To perform model debugging in such cases, you can usetheoffline_analyzer binary oftfdbg (described below). It operates ondumped data directories. This can be done to both the lower-levelSession APIand the higher-levelEstimator andExperiment APIs.
Debugging Remote tf.Sessions
If you interact directly with the tf.Session API in python, you canconfigure theRunOptions proto that you call yourSession.run() methodwith, by using the methodtfdbg.watch_graph.This will cause the intermediate tensors and runtime graphs to be dumped to ashared storage location of your choice when theSession.run() call occurs(at the cost of slower performance). For example:
-
from tensorflow.python import debug as tf_debug
-
-
# ... Code where your session and graph are set up...
-
-
run_options = tf.RunOptions()
-
tf_debug.watch_graph(
-
run_options,
-
session.graph,
-
debug_urls=["file:///shared/storage/location/tfdbg_dumps_1"])
-
# Be sure to specify different directories for different run() calls.
-
-
session.run(fetches, feed_dict=feeds, options=run_options)
-
Later, in an environment that you have terminal access to (for example, a localcomputer that can access the shared storage location specified in the codeabove), you can load and inspect the data in the dump directory on the sharedstorage by using theoffline_analyzer binary of tfdbg. For example:
python -m tensorflow.python.debug.cli.offline_analyzer \
    --dump_dir=/shared/storage/location/tfdbg_dumps_1
The Session wrapper DumpingDebugWrapperSession offers an easier and moreflexible way to generate file-system dumps that can be analyzed offline.To use it, simply wrap your session in atf_debug.DumpingDebugWrapperSession.For example:
-
# Let your BUILD target depend on "//tensorflow/python/debug:debug_py
-
# (You don't need to worry about the BUILD dependency if you are using a pip
-
# install of open-source TensorFlow.)
-
from tensorflow.python import debug as tf_debug
-
-
sess = tf_debug.DumpingDebugWrapperSession(
-
sess, "/shared/storage/location/tfdbg_dumps_1/", watch_fn=my_watch_fn)
-
The watch_fn argument accepts a Callable that allows you to configure whattensors to watch on differentSession.run() calls, as a function of thefetches andfeed_dict to therun() call and other states.
C++ and other languages
If your model code is written in C++ or other languages, you can alsomodify thedebug_options field ofRunOptions to generate debug dumps thatcan be inspected offline. Seethe proto definitionfor more details.
Debugging Remotely-Running tf-learn Estimators and Experiments
If your remote TensorFlow server runs Estimators,you can use the non-interactiveDumpingDebugHook. For example:
-
# Let your BUILD target depend on "//tensorflow/python/debug:debug_py
-
# (You don't need to worry about the BUILD dependency if you are using a pip
-
# install of open-source TensorFlow.)
-
from tensorflow.python import debug as tf_debug
-
-
hooks = [tf_debug.DumpingDebugHook("/shared/storage/location/tfdbg_dumps_1")]
-
Then this hook can be used in the same way as the LocalCLIDebugHook examplesdescribed earlier in this document.As the training and/or evalution ofEstimator orExperimenthappens, tfdbg creates directories having the following name pattern:/shared/storage/location/tfdbg_dumps_1/run_<epoch_timestamp_microsec>_<uuid>.Each directory corresponds to aSession.run() call that underliesthefit() orevaluate() call. You can load these directories and inspectthem in a command-line interface in an offline manner using theoffline_analyzer offered by tfdbg. For example:
-
python
-
m tensorflow
.
python
.
debug
.
cli
.
offline_analyzer
\
-
--
dump_dir
=
"/shared/storage/location/tfdbg_dumps_1/run_<epoch_timestamp_microsec>_<uuid>"
-
Frequently Asked Questions
Q: Do the timestamps on the left side of the lt output reflect actual performance in a non-debugging session?
A: No. The debugger inserts additional special-purpose debug nodes to the graph to record the values of intermediate tensors. These nodes slow down the graph execution. If you are interested in profiling your model, check out
- The profiling mode of tfdbg:
tfdbg> run -p. - tfprof and other profiling tools for TensorFlow.
Q: How do I link tfdbg against my Session in Bazel? Why do I see an error such as "ImportError: cannot import name debug"?
A: In your BUILD rule, declare dependencies: "//tensorflow:tensorflow_py" and"//tensorflow/python/debug:debug_py". The first is the dependency that you include to use TensorFlow even without debugger support; the second enables the debugger. Then, In your Python file, add:
-
from tensorflow.python import debug as tf_debug
-
-
# Then wrap your TensorFlow Session with the local-CLI wrapper.
-
sess = tf_debug.LocalCLIDebugWrapperSession(sess)
-
Q: Does tfdbg help debug runtime errors such as shape mismatches?
A: Yes. tfdbg intercepts errors generated by ops during runtime and presents the errors with some debug instructions to the user in the CLI. See examples:
# Debugging shape mismatch during matrix multiplication.
python -m tensorflow.python.debug.examples.debug_errors \
    --error shape_mismatch --debug


 2245
2245


 被折叠的 条评论
为什么被折叠?
被折叠的 条评论
为什么被折叠?
 到【灌水乐园】发言


