


1. 要注意,他是依赖userdata分区挂在的,如果没挂在就去时能会出事,解析错误,这时候要修改bootchart.cpp 修改读取和存取的路径
BOARD_KERNEL_CMDLINE += androidboot.selinux=disabled
BOARD_KERNEL_CMDLINE += androidboot.bootchart=120000
2. 如果出现解析错误,请下载https://github.com/xrmx/bootchart
pybootchartgui.py xxx.tgz
============msm8974===android M==========
system/core/rootdir/init.rc
# Start bootcharting as soon as possible after the data partition is
# mounted to collect more data.
mkdir /data/bootchart 0755 shell shell
bootchart_init
Bootcharting
------------
This version of init contains code to perform "bootcharting": generating log
files that can be later processed by the tools provided by www.bootchart.org.

On the emulator, use the -bootchart <timeout> option to boot with bootcharting
activated for <timeout> seconds.

On a device, create /data/bootchart/start with a command like the following:

  adb shell 'echo $TIMEOUT > /data/bootchart/start'

Where the value of $TIMEOUT corresponds to the desired bootcharted period in
seconds. Bootcharting will stop after that many seconds have elapsed.
You can also stop the bootcharting at any moment by doing the following:

  adb shell 'echo 1 > /data/bootchart/stop'

Note that /data/bootchart/stop is deleted automatically by init at the end of
the bootcharting. This is not the case with /data/bootchart/start, so don't
forget to delete it when you're done collecting data.

The log files are written to /data/bootchart/. A script is provided to
retrieve them and create a bootchart.tgz file that can be used with the
bootchart command-line utility:

  sudo apt-get install pybootchartgui
  # grab-bootchart.sh uses $ANDROID_SERIAL.
  $ANDROID_BUILD_TOP/system/core/init/grab-bootchart.sh

One thing to watch for is that the bootchart will show init as if it started
running at 0s. You'll have to look at dmesg to work out when the kernel
actually started init.
xxx:/data/bootchart # echo 120 > start
system/core/init (master) $ bash -x grab-bootchart.sh
===========================
=================OLD===============
This version of init contains code to perform "bootcharting", i.e. generating log
files that can be later processed by the tools provided by www.bootchart.org.To activate it, you need to define build 'init' with the INIT_BOOTCHART environment
variable defined to 'true', for example:
touch system/init/init.c
m INIT_BOOTCHART=true
On the emulator, use the new -bootchart <timeout> option to boot with bootcharting
activated for <timeout> seconds.
Otherwise, flash your device, and start it. Then create a file on the /data partition
with a command like the following:
adb shell 'echo $TIMEOUT > /data/bootchart-start'
Where the value of $TIMEOUT corresponds to the wanted bootcharted period in seconds;
for example, to bootchart for 2 minutes, do:
adb shell 'echo 120 > /data/bootchart-start'
Reboot your device, bootcharting will begin and stop after the period you gave.
You can also stop the bootcharting at any moment by doing the following:
adb shell 'echo 1 > /data/bootchart-stop'
Note that /data/bootchart-stop is deleted automatically by init at the end of the
bootcharting. This is not the case of /data/bootchart-start, so don't forget to delete it
when you're done collecting data:
adb shell rm /data/bootchart-start
The log files are placed in /data/bootchart/. you must run the script tools/grab-bootchart.sh
which will use ADB to retrieve them and create a bootchart.tgz file that can be used with
the bootchart parser/renderer, or even uploaded directly to the form located at:
http://www.bootchart.org/download.html
NOTE: the bootchart.org webform doesn't seem to work at the moment, you can generate an
image on your machine by doing the following:
1/ download the sources from www.bootchart.org
2/ unpack them
3/ in the source directory, type 'ant' to build the bootchart program
4/ type 'java -jar bootchart.jar /path/to/bootchart.tgz
technical note:
this implementation of bootcharting does use the 'bootchartd' script provided by
www.bootchart.org, but a C re-implementation that is directly compiled into our init
program.
=========================================================================================================================
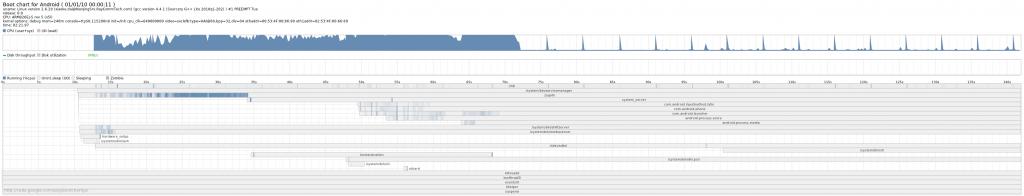
bootchart本是一个开源工具,用可视化的方式对GUN/LINUX的开机启动过程进行性能分析,包括资源的使用,如CPU,磁盘等,各进程的执行时间等信息。根据分析结果,确定系统启动的性能瓶颈,制定相应的优化策略。关于bootchart的来历和说明件其官方网站:点击打开链接
Android系统中已有一份bootchart的c实现,位于system/core/init/bootchart.c中。bootchart对Android开机测量是通过内建在init进程中实现的,在后台执行测量。不过bootchart的测量时段是从bootchart被初始化之后到home screen出来之前,不包括bootloader和kernel的执行时间。
我的系统是UBuntu10.04,现将整个使用步骤归纳如下:
1)、UBuntu下bootchart工具的安装
2)、bootchart在Android下的编译
3)、bootchart在Android下的执行
4)、bootchart测量结果的图形化过程
下面依次对上述四个步骤进行详细说明。
1、UBuntu下bootchart工具的安装
需要安装的工具有两个bootchart和pybootchartgui,执行命令如下:
- sudo apt-get install bootchart
- sudo apt-get install pybootchartgui
2、bootchart在Android下的编译
Android系统编译时,默认的没有打开bootchart的编译开关,即没有把bootchart编译进系统中。要把bootchart编进系统分为两种情况了:
1)、系统没有被编译过或者执行了make clean命令,可以执行以下命令:
- $ cd mydroid
- $ export INIT_BOOTCHART=true
- $ make clean
- $ make
- $ touch system/core/init/init.c
- $ m INIT_BOOTCHART=true
其中touch命令的作用就是将init.c文件的最后修改时间改为当前时间,这样保证init.c文件会被重新make,而bootchart就是在init.c中被调用的,从而保证bootchart会被编进系统中。
3、bootchart在Android下的执行
1}、将编译生成的带有bootchart工具的Android系统重新烧录到开发板上,并启动系统
2)、在UBuntu上通过adb connect连接到开发板,然后执行:
- $ adb shell 'echo 120 > /data/bootchart-start'
3)、执行命令:
- $ adb shell 'mkdir /data/bootchart'
4)、重新启动开发板,在开发板的Android系统的/data/bootchart/目录下将看到以下文件:
- # ls -l
- -rw-rw-rw- root root 452 2010-01-01 00:00 header
- -rw-r--r-- root root 0 2010-01-01 00:00 kernel_pacct
- -rwxr-xr-x root root 1020195 2010-01-01 00:02 proc_diskstats.log
- -rwxr-xr-x root root 4252966 2010-01-01 00:02 proc_ps.log
- -rwxr-xr-x root root 138215 2010-01-01 00:02 proc_stat.log
4、bootchart测量结果的图形化过程
1)、到这里要夸奖下android做的比较贴心,已经写好了脚本将bootchart测量生成的数据直接从开发板上打包出来,生成bootchart.tgz。这个打包脚是源码的system/core/init/grab-bootchart.sh文件,和bootchart源码位于同一目录下。脚本的内容如下:
- #!/bin/sh
- #
- # this script is used to retrieve the bootchart log generated
- # by init when compiled with INIT_BOOTCHART=true.
- #
- # for all details, see //device/system/init/README.BOOTCHART
- #
- TMPDIR=/tmp/android-bootchart
- rm -rf $TMPDIR
- mkdir -p $TMPDIR
- LOGROOT=/data/bootchart
- TARBALL=bootchart.tgz
- FILES="header proc_stat.log proc_ps.log proc_diskstats.log kernel_pacct"
- for f in $FILES; do
- adb pull $LOGROOT/$f $TMPDIR/$f 2>&1 > /dev/null
- done
- (cd $TMPDIR && tar -czf $TARBALL $FILES)
- cp -f $TMPDIR/$TARBALL ./$TARBALL
- echo "look at $TARBALL"
2)、在bootchart.tgz所在目录下执行命令:
- $bootchart ./bootchart.tgz
5、问题总结
在执行第4步的2)时,即执行命令:
- $bootchart ./bootchart.tgz
- parsing './bootchart.tgz'
- parsing 'header'
- parsing 'proc_stat.log'
- parsing 'proc_ps.log'
- warning: no parent for pid '2' with ppid '0'
- parsing 'proc_diskstats.log'
- parsing 'kernel_pacct'
- merged 0 logger processes
- pruned 61 process, 0 exploders, 2 threads, and 0 runs
- False
- Traceback (most recent call last):
- File "/usr/bin/bootchart", line 23, in <module>
- sys.exit(main())
- File "/usr/lib/pymodules/python2.7/pybootchartgui/main.py", line 137, in main
- render()
- File "/usr/lib/pymodules/python2.7/pybootchartgui/main.py", line 128, in render
- batch.render(writer, res, options, filename)
- File "/usr/lib/pymodules/python2.7/pybootchartgui/batch.py", line 41, in render
- draw.render(ctx, options, *res)
- File "/usr/lib/pymodules/python2.7/pybootchartgui/draw.py", line 282, in render
- draw_chart(ctx, IO_COLOR, True, chart_rect, [(sample.time, sample.util) for sample in disk_stats], proc_tree)
- File "/usr/lib/pymodules/python2.7/pybootchartgui/draw.py", line 201, in draw_chart
- yscale = float(chart_bounds[3]) / max(y for (x,y) in data)
- ZeroDivisionError: float division by zero
- bootchart ./bootchart.tgz


 833
833

 被折叠的 条评论
为什么被折叠?
被折叠的 条评论
为什么被折叠?
 到【灌水乐园】发言


