


一、Windows 8 图表控件的选择
免费的可选择有:modernuitoolkit,winrtxamltoolkit(其实它的chart也是集成modernuitoolkit的)
收费的可选择有:visifire
二、modernuitoolkit控件
2.1.1、MainPage页面
<Page
xmlns="http://schemas.microsoft.com/winfx/2006/xaml/presentation"
xmlns:x="http://schemas.microsoft.com/winfx/2006/xaml"
xmlns:local="using:ChartingTest"
xmlns:d="http://schemas.microsoft.com/expression/blend/2008"
xmlns:mc="http://schemas.openxmlformats.org/markup-compatibility/2006"
xmlns:Series="using:ModernUI.Toolkit.Data.Charting.Charts.Series"
xmlns:Axis="using:ModernUI.Toolkit.Data.Charting.Charts.Axis" xmlns:Charting="using:ModernUI.Toolkit.Data.Charting"
xmlns:DataPoints="using:ModernUI.Toolkit.Data.Charting.Charts.DataPoints"
xmlns:Chart="using:ModernUI.Toolkit.Data.Charting.Charts.Chart"
xmlns:series="using:ModernUI.Toolkit.Data.Charting.Charts.Series"
x:Class="ChartingTest.MainPage"
mc:Ignorable="d">
<Grid Background="{StaticResource ApplicationPageBackgroundThemeBrush}" x:Name="Root">
<Canvas x:Name="can" HorizontalAlignment="Left" Height="100" Margin="381,111,0,0" VerticalAlignment="Top" Width="100"/>
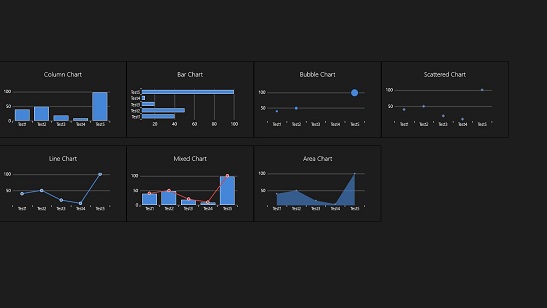
<Chart:Chart x:Name="Chart" HorizontalAlignment="Left" Title="Column Chart" Margin="-2,153,0,0" VerticalAlignment="Top" Width="318" Height="190">
<Chart:Chart.Series>
<series:ColumnSeries
Title="Population"
ItemsSource="{Binding Items}"
IndependentValueBinding="{Binding Name}"
DependentValueBinding="{Binding Value}" IsSelectionEnabled="True"/>
</Chart:Chart.Series>
</Chart:Chart>
<Chart:Chart x:Name="BarChart" HorizontalAlignment="Left" Title="Bar Chart" Margin="316,153,0,0" VerticalAlignment="Top" Width="318" Height="190">
<series:BarSeries
Title="Population"
IndependentValueBinding="{Binding Name}"
DependentValueBinding="{Binding Value}" IsSelectionEnabled="True"/>
</Chart:Chart>
<Chart:Chart x:Name="LineChart" HorizontalAlignment="Left" Title="Line Chart" Margin="-2,363,0,0" VerticalAlignment="Top" Width="318" Height="190">
<series:LineSeries
Title="Population"
IndependentValueBinding="{Binding Name}"
DependentValueBinding="{Binding Value}" IsSelectionEnabled="True"/>
</Chart:Chart>
<Chart:Chart x:Name="MixedChart" HorizontalAlignment="Left" Title="Mixed Chart" Margin="316,363,0,0" VerticalAlignment="Top" Width="318" Height="190">
<series:ColumnSeries
Title="Population"
ItemsSource="{Binding Items}"
IndependentValueBinding="{Binding Name}"
DependentValueBinding="{Binding Value}" IsSelectionEnabled="True"/>
<series:LineSeries
Title="Population"
IndependentValueBinding="{Binding Name}"
DependentValueBinding="{Binding Value}" IsSelectionEnabled="True"/>
</Chart:Chart>
<Chart:Chart x:Name="AreaChart" HorizontalAlignment="Left" Title="Area Chart" Margin="634,363,0,0" VerticalAlignment="Top" Width="318" Height="190">
<series:AreaSeries
Title="Population"
IndependentValueBinding="{Binding Name}"
DependentValueBinding="{Binding Value}" IsSelectionEnabled="True"/>
</Chart:Chart>
<Chart:Chart x:Name="BubbleChart" HorizontalAlignment="Left" Title="Bubble Chart" Margin="634,153,0,0" VerticalAlignment="Top" Width="318" Height="190">
<series:BubbleSeries
Title="Population"
IndependentValueBinding="{Binding Name}"
DependentValueBinding="{Binding Value}" IsSelectionEnabled="True"/>
</Chart:Chart>
<Chart:Chart x:Name="ScatteredChart" HorizontalAlignment="Left" Title="Scattered Chart" Margin="952,153,0,0" VerticalAlignment="Top" Width="318" Height="190">
<series:ScatterSeries
Title="Population"
IndependentValueBinding="{Binding Name}"
DependentValueBinding="{Binding Value}" IsSelectionEnabled="True"/>
</Chart:Chart>
</Grid>
</Page>
2.1.2、后台
using ModernUI.Toolkit.Data.Charting.Charts.Series;
using System;
using System.Collections.Generic;
using System.IO;
using System.Linq;
using Windows.Foundation;
using Windows.Foundation.Collections;
using Windows.UI.Xaml;
using Windows.UI.Xaml.Controls;
using Windows.UI.Xaml.Controls.Primitives;
using Windows.UI.Xaml.Data;
using Windows.UI.Xaml.Input;
using Windows.UI.Xaml.Media;
using Windows.UI.Xaml.Navigation;

// The Blank Page item template is documented at http://go.microsoft.com/fwlink/?LinkId=234238

namespace ChartingTest
{
    /// <summary>
    /// An empty page that can be used on its own or navigated to within a Frame.
    /// </summary>
    public sealed partial class MainPage : Page
    {
        public MainPage()
        {
            this.InitializeComponent();

            List<NameValueItem> items = new List<NameValueItem>();
            items.Add(new NameValueItem() { Name = "Test1", Value = 40 });
            items.Add(new NameValueItem() { Name = "Test2", Value = 50 });
            items.Add(new NameValueItem() { Name = "Test3", Value = 20 });
            items.Add(new NameValueItem() { Name = "Test4", Value = 10 });
            items.Add(new NameValueItem() { Name = "Test5", Value = 100 });

            ((ColumnSeries)Chart.Series[0]).ItemsSource = items;
            ((BarSeries)BarChart.Series[0]).ItemsSource = items;
            ((LineSeries)LineChart.Series[0]).ItemsSource = items;
            ((ColumnSeries)MixedChart.Series[0]).ItemsSource = items;
            ((LineSeries)MixedChart.Series[1]).ItemsSource = items;
            ((AreaSeries)AreaChart.Series[0]).ItemsSource = items;
            ((BubbleSeries)BubbleChart.Series[0]).ItemsSource = items;
            ((ScatterSeries)ScatteredChart.Series[0]).ItemsSource = items;
            this.Loaded += MainPage_Loaded;

        }

        void MainPage_Loaded(object sender, RoutedEventArgs e)
        {

        }

        /// <summary>
        /// Invoked when this page is about to be displayed in a Frame.
        /// </summary>
        /// <param name="e">Event data that describes how this page was reached.  The Parameter
        /// property is typically used to configure the page.</param>
        protected override void OnNavigatedTo(NavigationEventArgs e)
        {
        }
    }
    public class NameValueItem
    {
        private string _name;

        public string Name
        {
            get { return _name; }
            set { _name = value; }
        }
        private int _value;

        public int Value
        {
            get { return _value; }
            set { _value = value; }
        }
        public NameValueItem()
        {
        }
    }
}
2.1.3、效果
2.2.1、MainPage2页面
<common:LayoutAwarePage
xmlns="http://schemas.microsoft.com/winfx/2006/xaml/presentation"
xmlns:x="http://schemas.microsoft.com/winfx/2006/xaml"
xmlns:local="using:ChartingTest"
xmlns:common="using:ChartingTest.Common"
xmlns:d="http://schemas.microsoft.com/expression/blend/2008"
xmlns:mc="http://schemas.openxmlformats.org/markup-compatibility/2006"
xmlns:series="using:ModernUI.Toolkit.Data.Charting.Charts.Series"
xmlns:Chart="using:ModernUI.Toolkit.Data.Charting.Charts.Chart"
xmlns:axis="using:ModernUI.Toolkit.Data.Charting.Charts.Axis"
x:Name="pageRoot"
x:Class="ChartingTest.MainPage2"
DataContext="{Binding DefaultViewModel, RelativeSource={RelativeSource Mode=Self}}"
mc:Ignorable="d">
<common:LayoutAwarePage.Resources>
<!-- TODO: Delete this line if the key AppName is declared in App.xaml -->
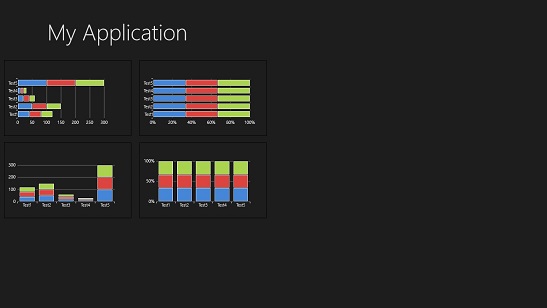
<x:String x:Key="AppName">My Application</x:String>
</common:LayoutAwarePage.Resources>
<!--
This grid acts as a root panel for the page that defines two rows:
* Row 0 contains the back button and page title
* Row 1 contains the rest of the page layout
-->
<Grid Style="{StaticResource LayoutRootStyle}">
<Grid.RowDefinitions>
<RowDefinition Height="140"/>
<RowDefinition Height="*"/>
</Grid.RowDefinitions>
<VisualStateManager.VisualStateGroups>
<!-- Visual states reflect the application's view state -->
<VisualStateGroup x:Name="ApplicationViewStates">
<VisualState x:Name="FullScreenLandscape"/>
<VisualState x:Name="Filled"/>
<!-- The entire page respects the narrower 100-pixel margin convention for portrait -->
<VisualState x:Name="FullScreenPortrait">
<Storyboard>
<ObjectAnimationUsingKeyFrames Storyboard.TargetName="backButton" Storyboard.TargetProperty="Style">
<DiscreteObjectKeyFrame KeyTime="0" Value="{StaticResource PortraitBackButtonStyle}"/>
</ObjectAnimationUsingKeyFrames>
</Storyboard>
</VisualState>
<!-- The back button and title have different styles when snapped -->
<VisualState x:Name="Snapped">
<Storyboard>
<ObjectAnimationUsingKeyFrames Storyboard.TargetName="backButton" Storyboard.TargetProperty="Style">
<DiscreteObjectKeyFrame KeyTime="0" Value="{StaticResource SnappedBackButtonStyle}"/>
</ObjectAnimationUsingKeyFrames>
<ObjectAnimationUsingKeyFrames Storyboard.TargetName="pageTitle" Storyboard.TargetProperty="Style">
<DiscreteObjectKeyFrame KeyTime="0" Value="{StaticResource SnappedPageHeaderTextStyle}"/>
</ObjectAnimationUsingKeyFrames>
</Storyboard>
</VisualState>
</VisualStateGroup>
</VisualStateManager.VisualStateGroups>
<!-- Back button and page title -->
<Grid>
<Grid.ColumnDefinitions>
<ColumnDefinition Width="Auto"/>
<ColumnDefinition Width="*"/>
</Grid.ColumnDefinitions>
<Button x:Name="backButton" Click="GoBack" IsEnabled="{Binding Frame.CanGoBack, ElementName=pageRoot}" Style="{StaticResource BackButtonStyle}"/>
<TextBlock x:Name="pageTitle" Grid.Column="1" Text="{StaticResource AppName}" Style="{StaticResource PageHeaderTextStyle}"/>
</Grid>
<Chart:Chart x:Name="StackedBar" HorizontalAlignment="Left" Margin="10,10,0,0" Grid.Row="1" VerticalAlignment="Top" Height="189" Width="318">
<series:StackedBarSeries>
<series:SeriesDefinition
DependentValuePath="Value"
IndependentValuePath="Name" IsTapEnabled="True"
Title="Doodad"/>
<series:SeriesDefinition
DependentValuePath="Value"
IndependentValuePath="Name" IsTapEnabled="True"
Title="Gizmo"/>
<series:SeriesDefinition
DependentValuePath="Value"
IndependentValuePath="Name" IsTapEnabled="True"
Title="Widget"/>
</series:StackedBarSeries>
</Chart:Chart>
<Chart:Chart x:Name="StackedBar100" HorizontalAlignment="Left" Margin="348,10,0,0" Grid.Row="1" VerticalAlignment="Top" Height="189" Width="318">
<series:Stacked100BarSeries>
<series:SeriesDefinition
DependentValuePath="Value"
IndependentValuePath="Name" IsTapEnabled="True"
Title="Doodad"/>
<series:SeriesDefinition
DependentValuePath="Value"
IndependentValuePath="Name" IsTapEnabled="True"
Title="Gizmo"/>
<series:SeriesDefinition
DependentValuePath="Value"
IndependentValuePath="Name" IsTapEnabled="True"
Title="Widget"/>
</series:Stacked100BarSeries>
</Chart:Chart>
<Chart:Chart x:Name="StackedColumn" HorizontalAlignment="Left" Margin="10,215,0,0" Grid.Row="1" VerticalAlignment="Top" Height="189" Width="318">
<series:StackedColumnSeries>
<series:SeriesDefinition
DependentValuePath="Value"
IndependentValuePath="Name" IsTapEnabled="True"
Title="Doodad"/>
<series:SeriesDefinition
DependentValuePath="Value"
IndependentValuePath="Name" IsTapEnabled="True"
Title="Gizmo"/>
<series:SeriesDefinition
DependentValuePath="Value"
IndependentValuePath="Name" IsTapEnabled="True"
Title="Widget"/>
</series:StackedColumnSeries>
</Chart:Chart>
<Chart:Chart x:Name="StackedColumn100" HorizontalAlignment="Left" Margin="348,215,0,0" Grid.Row="1" VerticalAlignment="Top" Height="189" Width="318">
<series:Stacked100ColumnSeries>
<series:SeriesDefinition
DependentValuePath="Value"
IndependentValuePath="Name" IsTapEnabled="True"
Title="Doodad"/>
<series:SeriesDefinition
DependentValuePath="Value"
IndependentValuePath="Name" IsTapEnabled="True"
Title="Gizmo"/>
<series:SeriesDefinition
DependentValuePath="Value"
IndependentValuePath="Name" IsTapEnabled="True"
Title="Widget"/>
</series:Stacked100ColumnSeries>
</Chart:Chart>
</Grid>
</common:LayoutAwarePage>
2.2.2、后台
using ModernUI.Toolkit.Data.Charting.Charts.Series;
using System;
using System.Collections.Generic;
using System.IO;
using System.Linq;
using Windows.Foundation;
using Windows.Foundation.Collections;
using Windows.UI.Xaml;
using Windows.UI.Xaml.Controls;
using Windows.UI.Xaml.Controls.Primitives;
using Windows.UI.Xaml.Data;
using Windows.UI.Xaml.Input;
using Windows.UI.Xaml.Media;
using Windows.UI.Xaml.Navigation;

// The Basic Page item template is documented at http://go.microsoft.com/fwlink/?LinkId=234237

namespace ChartingTest
{
    /// <summary>
    /// A basic page that provides characteristics common to most applications.
    /// </summary>
    public sealed partial class MainPage2 : ChartingTest.Common.LayoutAwarePage
    {
        public MainPage2()
        {
            this.InitializeComponent();
            List<NameValueItem> items = new List<NameValueItem>();
            items.Add(new NameValueItem() { Name = "Test1", Value = 40 });
            items.Add(new NameValueItem() { Name = "Test2", Value = 50 });
            items.Add(new NameValueItem() { Name = "Test3", Value = 20 });
            items.Add(new NameValueItem() { Name = "Test4", Value = 10 });
            items.Add(new NameValueItem() { Name = "Test5", Value = 100 });
            ((StackedBarSeries)StackedBar.Series[0]).SeriesDefinitions[0].ItemsSource = items;
            ((StackedBarSeries)StackedBar.Series[0]).SeriesDefinitions[1].ItemsSource = items;
            ((StackedBarSeries)StackedBar.Series[0]).SeriesDefinitions[2].ItemsSource = items;
            ((Stacked100BarSeries)StackedBar100.Series[0]).SeriesDefinitions[0].ItemsSource = items;
            ((Stacked100BarSeries)StackedBar100.Series[0]).SeriesDefinitions[1].ItemsSource = items;
            ((Stacked100BarSeries)StackedBar100.Series[0]).SeriesDefinitions[2].ItemsSource = items;

            ((StackedColumnSeries)StackedColumn.Series[0]).SeriesDefinitions[0].ItemsSource = items;
            ((StackedColumnSeries)StackedColumn.Series[0]).SeriesDefinitions[1].ItemsSource = items;
            ((StackedColumnSeries)StackedColumn.Series[0]).SeriesDefinitions[2].ItemsSource = items;

            ((Stacked100ColumnSeries)StackedColumn100.Series[0]).SeriesDefinitions[0].ItemsSource = items;
            ((Stacked100ColumnSeries)StackedColumn100.Series[0]).SeriesDefinitions[1].ItemsSource = items;
            ((Stacked100ColumnSeries)StackedColumn100.Series[0]).SeriesDefinitions[2].ItemsSource = items;
        }

        /// <summary>
        /// Populates the page with content passed during navigation.  Any saved state is also
        /// provided when recreating a page from a prior session.
        /// </summary>
        /// <param name="navigationParameter">The parameter value passed to
        /// <see cref="Frame.Navigate(Type, Object)"/> when this page was initially requested.
        /// </param>
        /// <param name="pageState">A dictionary of state preserved by this page during an earlier
        /// session.  This will be null the first time a page is visited.</param>
        protected override void LoadState(Object navigationParameter, Dictionary<String, Object> pageState)
        {
        }

        /// <summary>
        /// Preserves state associated with this page in case the application is suspended or the
        /// page is discarded from the navigation cache.  Values must conform to the serialization
        /// requirements of <see cref="SuspensionManager.SessionState"/>.
        /// </summary>
        /// <param name="pageState">An empty dictionary to be populated with serializable state.</param>
        protected override void SaveState(Dictionary<String, Object> pageState)
        {
        }
    }
}
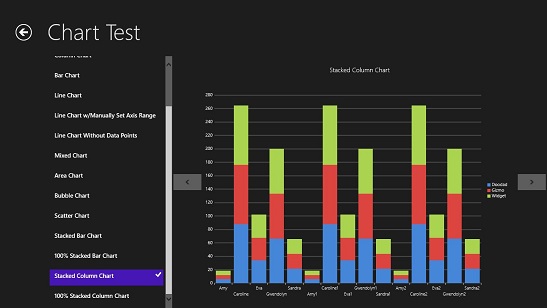
2.2.3、效果
三、winrtxamltoolkit控件
3.1、ChartPage页面
<controls:AlternativePage
x:Class="Charts.ChartPage"
IsTabStop="false"
xmlns="http://schemas.microsoft.com/winfx/2006/xaml/presentation"
xmlns:x="http://schemas.microsoft.com/winfx/2006/xaml"
xmlns:controls="using:WinRTXamlToolkit.Controls"
xmlns:d="http://schemas.microsoft.com/expression/blend/2008"
xmlns:mc="http://schemas.openxmlformats.org/markup-compatibility/2006"
mc:Ignorable="d"
xmlns:charting="using:WinRTXamlToolkit.Controls.DataVisualization.Charting"
xmlns:Series="using:WinRTXamlToolkit.Controls.DataVisualization.Charting"
xmlns:datavis="using:WinRTXamlToolkit.Controls.DataVisualization">
<Grid
Background="{StaticResource ApplicationPageBackgroundThemeBrush}">
<Grid.RowDefinitions>
<RowDefinition
Height="140" />
<RowDefinition />
</Grid.RowDefinitions>
<Grid.ColumnDefinitions>
<ColumnDefinition
Width="120" />
<ColumnDefinition
Width="310" />
<ColumnDefinition
Width="*" />
</Grid.ColumnDefinitions>
<controls:CustomAppBar
Grid.Row="1"
Grid.ColumnSpan="3"
VerticalAlignment="Bottom">
<StackPanel
Orientation="Horizontal">
<Button
Content="Update"
Click="OnUpdateButtonClick" />
</StackPanel>
</controls:CustomAppBar>
<Button
x:Name="BackButton"
Style="{StaticResource BackButtonStyle}"
Click="GoBack" />
<TextBlock
Text="Chart Test"
Grid.Column="1"
Grid.ColumnSpan="2"
Style="{StaticResource PageHeaderTextStyle}" />
<ListView
x:Name="ChartsIndex"
Grid.Row="1"
Grid.Column="1"
SelectionMode="Single"
SelectedIndex="{Binding SelectedIndex, ElementName=ChartsList, Mode=TwoWay}">
<ListView.ItemContainerStyle>
<Style
TargetType="ListViewItem">
<Setter
Property="Padding"
Value="12,5" />
<Setter
Property="FontWeight"
Value="SemiBold" />
</Style>
</ListView.ItemContainerStyle>
<TextBlock>Pie Chart</TextBlock>
<TextBlock>Pie Chart with Custom Design</TextBlock>
<TextBlock>Column Chart</TextBlock>
<TextBlock>Bar Chart</TextBlock>
<TextBlock>Line Chart</TextBlock>
<TextBlock>Line Chart w/Manually Set Axis Range</TextBlock>
<TextBlock>Line Chart Without Data Points</TextBlock>
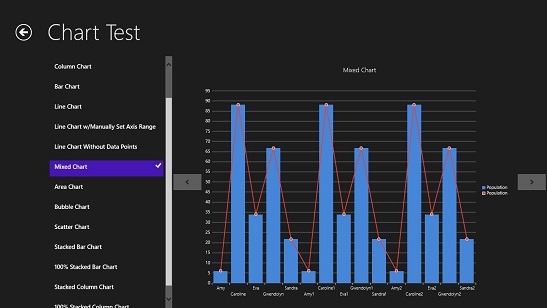
<TextBlock>Mixed Chart</TextBlock>
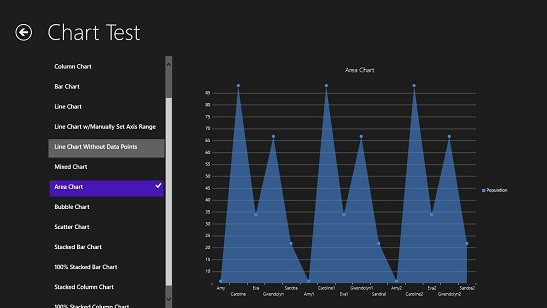
<TextBlock>Area Chart</TextBlock>
<TextBlock>Bubble Chart</TextBlock>
<TextBlock>Scatter Chart</TextBlock>
<TextBlock>Stacked Bar Chart</TextBlock>
<TextBlock>100% Stacked Bar Chart</TextBlock>
<TextBlock>Stacked Column Chart</TextBlock>
<TextBlock>100% Stacked Column Chart</TextBlock>
<!--ItemsSource="{Binding Items, ElementName=ChartsList}"
DisplayMemberPath="Content.Title">-->
</ListView>
<FlipView
x:Name="ChartsList"
Grid.Column="2"
Grid.Row="1">
<charting:Chart
x:Name="PieChart"
Title="Pie Chart"
Margin="70,0">
<charting:Chart.Series>
<Series:PieSeries
Title="Population"
ItemsSource="{Binding Items}"
IndependentValueBinding="{Binding Name}"
DependentValueBinding="{Binding Value}"
IsSelectionEnabled="True" />
</charting:Chart.Series>
</charting:Chart>
<charting:Chart
x:Name="PieChartWithCustomDesign"
Title="Pie Chart with Custom Design"
Margin="70,0">
<charting:Chart.Palette>
<charting:ResourceDictionaryCollection>
<!-- Gold -->
<ResourceDictionary>
<SolidColorBrush
x:Key="Background"
Color="Gold" />
<Style
x:Key="DataPointStyle"
TargetType="Control">
<Setter
Property="Background"
Value="{StaticResource Background}" />
</Style>
<Style
x:Key="DataShapeStyle"
TargetType="Shape">
<Setter
Property="Stroke"
Value="{StaticResource Background}" />
<Setter
Property="StrokeThickness"
Value="2" />
<Setter
Property="StrokeMiterLimit"
Value="1" />
<Setter
Property="Fill"
Value="{StaticResource Background}" />
</Style>
</ResourceDictionary>
<!-- Green -->
<ResourceDictionary>
<SolidColorBrush
x:Key="Background"
Color="GreenYellow" />
<Style
x:Key="DataPointStyle"
TargetType="Control">
<Setter
Property="Background"
Value="{StaticResource Background}" />
</Style>
<Style
x:Key="DataShapeStyle"
TargetType="Shape">
<Setter
Property="Stroke"
Value="{StaticResource Background}" />
<Setter
Property="StrokeThickness"
Value="2" />
<Setter
Property="StrokeMiterLimit"
Value="1" />
<Setter
Property="Fill"
Value="{StaticResource Background}" />
</Style>
</ResourceDictionary>
<!-- Blue -->
<ResourceDictionary>
<SolidColorBrush
x:Key="Background"
Color="LightSkyBlue" />
<Style
x:Key="DataPointStyle"
TargetType="Control">
<Setter
Property="Background"
Value="{StaticResource Background}" />
</Style>
<Style
x:Key="DataShapeStyle"
TargetType="Shape">
<Setter
Property="Stroke"
Value="{StaticResource Background}" />
<Setter
Property="StrokeThickness"
Value="2" />
<Setter
Property="StrokeMiterLimit"
Value="1" />
<Setter
Property="Fill"
Value="{StaticResource Background}" />
</Style>
</ResourceDictionary>
<!-- Purple -->
<ResourceDictionary>
<SolidColorBrush
x:Key="Background"
Color="MediumPurple" />
<Style
x:Key="DataPointStyle"
TargetType="Control">
<Setter
Property="Background"
Value="{StaticResource Background}" />
</Style>
<Style
x:Key="DataShapeStyle"
TargetType="Shape">
<Setter
Property="Stroke"
Value="{StaticResource Background}" />
<Setter
Property="StrokeThickness"
Value="2" />
<Setter
Property="StrokeMiterLimit"
Value="1" />
<Setter
Property="Fill"
Value="{StaticResource Background}" />
</Style>
</ResourceDictionary>
<!-- Brown -->
<ResourceDictionary>
<SolidColorBrush
x:Key="Background"
Color="SandyBrown" />
<Style
x:Key="DataPointStyle"
TargetType="Control">
<Setter
Property="Background"
Value="{StaticResource Background}" />
</Style>
<Style
x:Key="DataShapeStyle"
TargetType="Shape">
<Setter
Property="Stroke"
Value="{StaticResource Background}" />
<Setter
Property="StrokeThickness"
Value="2" />
<Setter
Property="StrokeMiterLimit"
Value="1" />
<Setter
Property="Fill"
Value="{StaticResource Background}" />
</Style>
</ResourceDictionary>
</charting:ResourceDictionaryCollection>
</charting:Chart.Palette>
<charting:Chart.TitleStyle>
<Style
TargetType="datavis:Title">
<Setter
Property="Background"
Value="#444" />
<Setter
Property="HorizontalContentAlignment"
Value="Center" />
<Setter
Property="VerticalContentAlignment"
Value="Top" />
<Setter
Property="IsTabStop"
Value="False" />
<Setter
Property="Padding"
Value="10" />
<Setter
Property="Template">
<Setter.Value>
<ControlTemplate
TargetType="datavis:Title">
<Border
CornerRadius="10"
Background="{TemplateBinding Background}">
<ContentPresenter
FontSize="36"
FontWeight="SemiBold"
FontStretch="Condensed"
Content="{TemplateBinding Content}"
ContentTemplate="{TemplateBinding ContentTemplate}"
Margin="{TemplateBinding Padding}"
HorizontalAlignment="{TemplateBinding HorizontalContentAlignment}"
VerticalAlignment="{TemplateBinding VerticalContentAlignment}" />
</Border>
</ControlTemplate>
</Setter.Value>
</Setter>
</Style>
</charting:Chart.TitleStyle>
<charting:Chart.LegendStyle>
<Style
TargetType="datavis:Legend">
<Setter
Property="VerticalAlignment"
Value="Stretch" />
<Setter
Property="Background"
Value="#444" />
<Setter
Property="ItemsPanel">
<Setter.Value>
<ItemsPanelTemplate>
<controls:UniformGrid
Columns="1"
Rows="15" />
</ItemsPanelTemplate>
</Setter.Value>
</Setter>
<Setter
Property="TitleStyle">
<Setter.Value>
<Style
TargetType="datavis:Title">
<Setter
Property="Margin"
Value="0,5,0,10" />
<Setter
Property="FontWeight"
Value="Bold" />
<Setter
Property="HorizontalAlignment"
Value="Center" />
</Style>
</Setter.Value>
</Setter>
<Setter
Property="ItemContainerStyle"
xmlns:series="using:WinRTXamlToolkit.Controls.DataVisualization.Charting">
<Setter.Value>
<Style
TargetType="series:LegendItem">
<Setter
Property="Template">
<Setter.Value>
<ControlTemplate
TargetType="series:LegendItem">
<Border
MinWidth="200"
Margin="20,10"
CornerRadius="10"
VerticalAlignment="Stretch"
HorizontalAlignment="Stretch"
Background="{Binding Background}">
<datavis:Title
HorizontalAlignment="Center"
VerticalAlignment="Center"
FontSize="24"
FontWeight="Bold"
Content="{TemplateBinding Content}" />
</Border>
</ControlTemplate>
</Setter.Value>
</Setter>
</Style>
</Setter.Value>
</Setter>
<Setter
Property="Template">
<Setter.Value>
<ControlTemplate
TargetType="datavis:Legend">
<Border
CornerRadius="10"
Background="{TemplateBinding Background}"
BorderBrush="{TemplateBinding BorderBrush}"
BorderThickness="{TemplateBinding BorderThickness}"
Padding="2">
<Grid>
<Grid.RowDefinitions>
<RowDefinition
Height="Auto" />
<RowDefinition />
</Grid.RowDefinitions>
<datavis:Title
Grid.Row="0"
x:Name="HeaderContent"
Content="{TemplateBinding Header}"
ContentTemplate="{TemplateBinding HeaderTemplate}"
Style="{TemplateBinding TitleStyle}" />
<ScrollViewer
Grid.Row="1"
VerticalScrollBarVisibility="Auto"
BorderThickness="0"
Padding="0"
IsTabStop="False">
<ItemsPresenter
x:Name="Items"
Margin="10,0,10,10" />
</ScrollViewer>
</Grid>
</Border>
</ControlTemplate>
</Setter.Value>
</Setter>
</Style>
</charting:Chart.LegendStyle>
<charting:Chart.Series>
<Series:PieSeries
Title="Population"
ItemsSource="{Binding Items}"
IndependentValueBinding="{Binding Name}"
DependentValueBinding="{Binding Value}"
IsSelectionEnabled="True" />
</charting:Chart.Series>
</charting:Chart>
<charting:Chart
x:Name="Chart"
Title="Column Chart"
Margin="70,0">
<charting:Chart.Series>
<charting:ColumnSeries
Title="Population"
ItemsSource="{Binding Items}"
IndependentValueBinding="{Binding Name}"
DependentValueBinding="{Binding Value}"
IsSelectionEnabled="True" />
</charting:Chart.Series>
</charting:Chart>
<charting:Chart
x:Name="BarChart"
Title="Bar Chart"
Margin="70,0">
<charting:BarSeries
Title="Population"
IndependentValueBinding="{Binding Name}"
DependentValueBinding="{Binding Value}"
IsSelectionEnabled="True" />
</charting:Chart>
<charting:Chart
x:Name="LineChart"
Title="Line Chart"
Margin="70,0">
<charting:LineSeries
Title="Population"
IndependentValueBinding="{Binding Name}"
DependentValueBinding="{Binding Value}"
IsSelectionEnabled="True" />
</charting:Chart>
<charting:Chart
x:Name="LineChartWithAxes"
Title="Line Chart w/Manually Set Axis Range"
Margin="70,0">
<charting:LineSeries
Title="Population"
IndependentValueBinding="{Binding Name}"
DependentValueBinding="{Binding Value}"
IsSelectionEnabled="True" />
</charting:Chart>
<charting:Chart
x:Name="LineChart2"
Title="Line Chart Without Data Points"
Margin="70,0">
<charting:LineSeries
Title="Population"
IndependentValueBinding="{Binding Name}"
DependentValueBinding="{Binding Value}"
IsSelectionEnabled="True">
<charting:LineSeries.DataPointStyle>
<Style
TargetType="charting:LineDataPoint">
<Setter
Property="BorderThickness"
Value="0" />
<Setter
Property="IsTabStop"
Value="False" />
<Setter
Property="Width"
Value="0" />
<Setter
Property="Height"
Value="0" />
<Setter
Property="Template">
<Setter.Value>
<ControlTemplate
TargetType="charting:LineDataPoint">
<Grid
x:Name="Root"
Opacity="0" />
</ControlTemplate>
</Setter.Value>
</Setter>
</Style>
</charting:LineSeries.DataPointStyle>
</charting:LineSeries>
</charting:Chart>
<charting:Chart
x:Name="MixedChart"
Title="Mixed Chart"
Margin="70,0">
<charting:ColumnSeries
Title="Population"
ItemsSource="{Binding Items}"
IndependentValueBinding="{Binding Name}"
DependentValueBinding="{Binding Value}"
IsSelectionEnabled="True" />
<charting:LineSeries
Title="Population"
IndependentValueBinding="{Binding Name}"
DependentValueBinding="{Binding Value}"
IsSelectionEnabled="True" />
</charting:Chart>
<charting:Chart
x:Name="AreaChart"
Title="Area Chart"
Margin="70,0">
<charting:AreaSeries
Title="Population"
IndependentValueBinding="{Binding Name}"
DependentValueBinding="{Binding Value}"
IsSelectionEnabled="True" />
</charting:Chart>
<charting:Chart
x:Name="BubbleChart"
Title="Bubble Chart"
Margin="70,0">
<charting:BubbleSeries
Title="Population"
IndependentValueBinding="{Binding Name}"
DependentValueBinding="{Binding Value}"
IsSelectionEnabled="True" />
</charting:Chart>
<charting:Chart
x:Name="ScatterChart"
Title="Scatter Chart"
Margin="70,0">
<charting:ScatterSeries
Title="Population"
IndependentValueBinding="{Binding Name}"
DependentValueBinding="{Binding Value}"
IsSelectionEnabled="True" />
</charting:Chart>
<charting:Chart
x:Name="StackedBar"
Title="Stacked Bar Chart"
Margin="70,0">
<charting:StackedBarSeries>
<charting:SeriesDefinition
DependentValuePath="Value"
IndependentValuePath="Name"
IsTapEnabled="True"
Title="Doodad" />
<charting:SeriesDefinition
DependentValuePath="Value"
IndependentValuePath="Name"
IsTapEnabled="True"
Title="Gizmo" />
<charting:SeriesDefinition
DependentValuePath="Value"
IndependentValuePath="Name"
IsTapEnabled="True"
Title="Widget" />
</charting:StackedBarSeries>
</charting:Chart>
<charting:Chart
x:Name="StackedBar100"
Title="100% Stacked Bar Chart"
Margin="70,0">
<charting:Stacked100BarSeries>
<charting:SeriesDefinition
DependentValuePath="Value"
IndependentValuePath="Name"
IsTapEnabled="True"
Title="Doodad" />
<charting:SeriesDefinition
DependentValuePath="Value"
IndependentValuePath="Name"
IsTapEnabled="True"
Title="Gizmo" />
<charting:SeriesDefinition
DependentValuePath="Value"
IndependentValuePath="Name"
IsTapEnabled="True"
Title="Widget" />
</charting:Stacked100BarSeries>
</charting:Chart>
<charting:Chart
x:Name="StackedColumn"
Title="Stacked Column Chart"
Margin="70,0">
<charting:StackedColumnSeries>
<charting:SeriesDefinition
DependentValuePath="Value"
IndependentValuePath="Name"
IsTapEnabled="True"
Title="Doodad" />
<charting:SeriesDefinition
DependentValuePath="Value"
IndependentValuePath="Name"
IsTapEnabled="True"
Title="Gizmo" />
<charting:SeriesDefinition
DependentValuePath="Value"
IndependentValuePath="Name"
IsTapEnabled="True"
Title="Widget" />
</charting:StackedColumnSeries>
</charting:Chart>
<charting:Chart
x:Name="StackedColumn100"
Title="100% Stacked Column Chart"
Margin="70,0">
<Series:Stacked100ColumnSeries>
<charting:SeriesDefinition
DependentValuePath="Value"
IndependentValuePath="Name"
IsTapEnabled="True"
Title="Doodad" />
<charting:SeriesDefinition
DependentValuePath="Value"
IndependentValuePath="Name"
IsTapEnabled="True"
Title="Gizmo" />
<charting:SeriesDefinition
DependentValuePath="Value"
IndependentValuePath="Name"
IsTapEnabled="True"
Title="Widget" />
</Series:Stacked100ColumnSeries>
</charting:Chart>
</FlipView>
</Grid>
</controls:AlternativePage>3.2、后台
using System;
using System.Collections.Generic;
using WinRTXamlToolkit.Controls;
using WinRTXamlToolkit.Controls.DataVisualization.Charting;
using System.IO;
using System.Linq;
using Windows.Foundation;
using Windows.Foundation.Collections;
using Windows.UI.Xaml;
using Windows.UI.Xaml.Controls;
using Windows.UI.Xaml.Controls.Primitives;
using Windows.UI.Xaml.Data;
using Windows.UI.Xaml.Input;
using Windows.UI.Xaml.Media;
using Windows.UI.Xaml.Navigation;

namespace Charts
{
    public sealed partial class ChartPage : AlternativePage
    {
        public ChartPage()
        {
            this.InitializeComponent();

            UpdateCharts();
        }

        private Random _random = new Random();

        private void UpdateCharts()
        {
            List<NameValueItem> items = new List<NameValueItem>();
            //items.Add(new NameValueItem { Name = "Test1", Value = _random.Next(10, 100) });
            //items.Add(new NameValueItem { Name = "Test2", Value = _random.Next(10, 100) });
            //items.Add(new NameValueItem { Name = "Test3", Value = _random.Next(10, 100) });
            //items.Add(new NameValueItem { Name = "Test4", Value = _random.Next(10, 100) });
            //items.Add(new NameValueItem { Name = "Test5", Value = _random.Next(10, 100) });
            items.Add(new NameValueItem { Name = "Amy", Value = 5.9 });
            items.Add(new NameValueItem { Name = "Caroline", Value = 88 });
            items.Add(new NameValueItem { Name = "Eva", Value = 33.8 });
            items.Add(new NameValueItem { Name = "Gwendolyn", Value = 66.6 });
            items.Add(new NameValueItem { Name = "Sandra", Value = 21.7 });

            items.Add(new NameValueItem { Name = "Amy1", Value = 5.9 });
            items.Add(new NameValueItem { Name = "Caroline1", Value = 88 });
            items.Add(new NameValueItem { Name = "Eva1", Value = 33.8 });
            items.Add(new NameValueItem { Name = "Gwendolyn1", Value = 66.6 });
            items.Add(new NameValueItem { Name = "Sandra1", Value = 21.7 });

            items.Add(new NameValueItem { Name = "Amy2", Value = 5.9 });
            items.Add(new NameValueItem { Name = "Caroline2", Value = 88 });
            items.Add(new NameValueItem { Name = "Eva2", Value = 33.8 });
            items.Add(new NameValueItem { Name = "Gwendolyn2", Value = 66.6 });
            items.Add(new NameValueItem { Name = "Sandra2", Value = 21.7 });

            ((ColumnSeries)this.Chart.Series[0]).ItemsSource = items;
            ((BarSeries)this.BarChart.Series[0]).ItemsSource = items;
            ((LineSeries)this.LineChart.Series[0]).ItemsSource = items;
            ((LineSeries)this.LineChart2.Series[0]).ItemsSource = items;
            ((ColumnSeries)this.MixedChart.Series[0]).ItemsSource = items;
            ((LineSeries)this.MixedChart.Series[1]).ItemsSource = items;
            ((AreaSeries)this.AreaChart.Series[0]).ItemsSource = items;
            ((BubbleSeries)this.BubbleChart.Series[0]).ItemsSource = items;
            ((ScatterSeries)this.ScatterChart.Series[0]).ItemsSource = items;
            ((StackedBarSeries)this.StackedBar.Series[0]).SeriesDefinitions[0].ItemsSource = items;
            ((StackedBarSeries)this.StackedBar.Series[0]).SeriesDefinitions[1].ItemsSource = items;
            ((StackedBarSeries)this.StackedBar.Series[0]).SeriesDefinitions[2].ItemsSource = items;
            ((Stacked100BarSeries)this.StackedBar100.Series[0]).SeriesDefinitions[0].ItemsSource =
                items;
            ((Stacked100BarSeries)this.StackedBar100.Series[0]).SeriesDefinitions[1].ItemsSource =
                items;
            ((Stacked100BarSeries)this.StackedBar100.Series[0]).SeriesDefinitions[2].ItemsSource =
                items;

            ((StackedColumnSeries)this.StackedColumn.Series[0]).SeriesDefinitions[0].ItemsSource =
                items;
            ((StackedColumnSeries)this.StackedColumn.Series[0]).SeriesDefinitions[1].ItemsSource =
                items;
            ((StackedColumnSeries)this.StackedColumn.Series[0]).SeriesDefinitions[2].ItemsSource =
                items;

            ((Stacked100ColumnSeries)this.StackedColumn100.Series[0]).SeriesDefinitions[0]
                .ItemsSource = items;
            ((Stacked100ColumnSeries)this.StackedColumn100.Series[0]).SeriesDefinitions[1]
                .ItemsSource = items;
            ((Stacked100ColumnSeries)this.StackedColumn100.Series[0]).SeriesDefinitions[2]
                .ItemsSource = items;

            ((PieSeries)this.PieChart.Series[0]).ItemsSource = items;
            ((PieSeries)this.PieChartWithCustomDesign.Series[0]).ItemsSource = items;
            ((LineSeries)LineChartWithAxes.Series[0]).ItemsSource = items;
            ((LineSeries)LineChartWithAxes.Series[0]).DependentRangeAxis =
                new LinearAxis
                {
                    Minimum = 0,
                    Maximum = 100,
                    Orientation = AxisOrientation.Y,
                    Interval = 20,
                    ShowGridLines = true
                };
        }

        private void GoBack(object sender, RoutedEventArgs e)
        {
            this.Frame.GoBack();
        }

        public class NameValueItem
        {
            public string Name { get; set; }
            public double Value { get; set; }
        }

        private void OnUpdateButtonClick(object sender, RoutedEventArgs e)
        {
            UpdateCharts();
        }
    }
}
3.3、App.cs后台
using System;
using System.Collections.Generic;
using System.IO;
using System.Linq;
using Windows.ApplicationModel;
using Windows.ApplicationModel.Activation;
using Windows.Foundation;
using Windows.Foundation.Collections;
using Windows.UI.Xaml;
using Windows.UI.Xaml.Controls;
using Windows.UI.Xaml.Controls.Primitives;
using Windows.UI.Xaml.Data;
using Windows.UI.Xaml.Input;
using Windows.UI.Xaml.Media;
using Windows.UI.Xaml.Navigation;

// “空白应用程序”模板在 http://go.microsoft.com/fwlink/?LinkId=234227 上有介绍

namespace Charts
{
    /// <summary>
    /// 提供特定于应用程序的行为,以补充默认的应用程序类。
    /// </summary>
    sealed partial class App : Application
    {
        /// <summary>
        /// 初始化单一实例应用程序对象。这是执行的创作代码的第一行,
        /// 逻辑上等同于 main() 或 WinMain()。
        /// </summary>
        public App()
        {
            this.InitializeComponent();
            this.Suspending += OnSuspending;
        }

        /// <summary>
        /// 在应用程序由最终用户正常启动时进行调用。
        /// 当启动应用程序以执行打开特定的文件或显示搜索结果等操作时
        /// 将使用其他入口点。
        /// </summary>
        /// <param name="args">有关启动请求和过程的详细信息。</param>
        //protected override void OnLaunched(LaunchActivatedEventArgs args)
        //{
        //    Frame rootFrame = Window.Current.Content as Frame;

        //    // 不要在窗口已包含内容时重复应用程序初始化,
        //    // 只需确保窗口处于活动状态
        //    if (rootFrame == null)
        //    {
        //        // 创建要充当导航上下文的框架,并导航到第一页
        //        rootFrame = new Frame();

        //        if (args.PreviousExecutionState == ApplicationExecutionState.Terminated)
        //        {
        //            //TODO: 从之前挂起的应用程序加载状态
        //        }

        //        // 将框架放在当前窗口中
        //        Window.Current.Content = rootFrame;
        //    }

        //    if (rootFrame.Content == null)
        //    {
        //        // 当未还原导航堆栈时,导航到第一页,
        //        // 并通过将所需信息作为导航参数传入来配置
        //        // 参数
        //        if (!rootFrame.Navigate(typeof(MainPage), args.Arguments))
        //        {
        //            throw new Exception("Failed to create initial page");
        //        }
        //    }
        //    // 确保当前窗口处于活动状态
        //    Window.Current.Activate();
        //}
        protected override void OnLaunched(LaunchActivatedEventArgs args)
        {
            if (args.PreviousExecutionState == ApplicationExecutionState.Terminated)
            {
                //TODO: Load state from previously suspended application
            }

            Window.Current.Content = new AppShell();
            Window.Current.Activate();
        }
        /// <summary>
        /// 在将要挂起应用程序执行时调用。在不知道应用程序
        /// 将被终止还是恢复的情况下保存应用程序状态,
        /// 并让内存内容保持不变。
        /// </summary>
        /// <param name="sender">挂起的请求的源。</param>
        /// <param name="e">有关挂起的请求的详细信息。</param>
        private void OnSuspending(object sender, SuspendingEventArgs e)
        {
            var deferral = e.SuspendingOperation.GetDeferral();
            //TODO: 保存应用程序状态并停止任何后台活动
            deferral.Complete();
        }
    }
}
3.4、效果


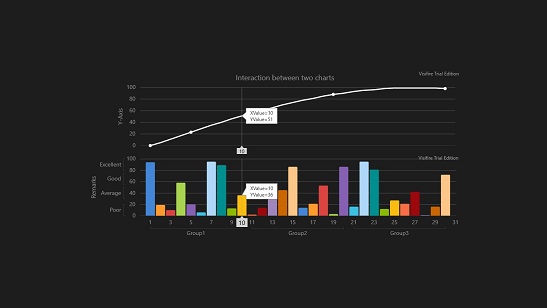
四、visifire控件
4.1、MainPage页面
<Page
    x:Class="IndicatorsInMultipleChartsForWindows8Metro.MainPage"
    xmlns="http://schemas.microsoft.com/winfx/2006/xaml/presentation"
    xmlns:x="http://schemas.microsoft.com/winfx/2006/xaml"
    xmlns:local="using:IndicatorsInMultipleChartsForWindows8Metro"
    xmlns:d="http://schemas.microsoft.com/expression/blend/2008"
    xmlns:mc="http://schemas.openxmlformats.org/markup-compatibility/2006"
    mc:Ignorable="d"
    xmlns:vc="using:Visifire.Charts"
    >
    <Grid x:Name="LayoutRoot" Background="{StaticResource ApplicationPageBackgroundThemeBrush}">
        <Grid.RowDefinitions>
            <RowDefinition Height="Auto"/>
            <RowDefinition Height="*"/>
        </Grid.RowDefinitions>

        <Grid x:Name="ContentPanel" Grid.Row="1" HorizontalAlignment="Center" VerticalAlignment="Center">
            <StackPanel>

                <vc:Chart Margin="67,0,0,0" Padding="5,5,15,14" HorizontalAlignment="Left" VerticalAlignment="Top" x:Name="Chart1" Width="870" Height="210" ScrollingEnabled="false" >

                    <vc:Chart.Titles>
                        <vc:Title Text="Interaction between two charts"/>
                    </vc:Chart.Titles>

                    <vc:Chart.AxesX>
                        <vc:Axis AxisMaximum="31" StartFromZero="true" IncludeZero="False" Enabled="false" Interval="2">
                        </vc:Axis>
                    </vc:Chart.AxesX>

                    <vc:Chart.AxesY>
                        <vc:Axis Title="Y-Axis" Interval="20">
                            <vc:Axis.AxisLabels>
                                <vc:AxisLabels />
                            </vc:Axis.AxisLabels>
                        </vc:Axis>
                    </vc:Chart.AxesY>

                </vc:Chart>

                <vc:Chart Padding="5,5,5,5" HorizontalAlignment="Left" VerticalAlignment="Top" x:Name="Chart2" Width="936" Height="210" ScrollingEnabled="false" AxisIndicatorFontSize="16">

                    <vc:Chart.AxesX>
                        <vc:Axis StartFromZero="true" AxisMaximum="31" Interval="2" >
                            <vc:Axis.AxisLabels>
                                <vc:AxisLabels ></vc:AxisLabels>
                            </vc:Axis.AxisLabels>
                            <vc:Axis.CustomAxisLabels>
                                <vc:CustomAxisLabels >
                                    <vc:CustomAxisLabels.Labels>
                                        <vc:CustomAxisLabel Text="Group1" From="1" To="10"/>
                                        <vc:CustomAxisLabel Text="Group2" From="11" To="20"/>
                                        <vc:CustomAxisLabel Text="Group3" From="21" To="30"/>
                                    </vc:CustomAxisLabels.Labels>
                                </vc:CustomAxisLabels>
                            </vc:Axis.CustomAxisLabels>

                        </vc:Axis>
                    </vc:Chart.AxesX>

                    <vc:Chart.AxesY>
                        <vc:Axis Title="Remarks" Interval="20">
                            <vc:Axis.AxisLabels>
                                <vc:AxisLabels />
                            </vc:Axis.AxisLabels>

                            <vc:Axis.CustomAxisLabels>
                                <vc:CustomAxisLabels>
                                    <vc:CustomAxisLabels.Labels>
                                        <vc:CustomAxisLabel Text="Poor" From="0" To="20"/>
                                        <vc:CustomAxisLabel Text="Average" From="30" To="50"/>
                                        <vc:CustomAxisLabel Text="Good" From="55" To="75"/>
                                        <vc:CustomAxisLabel Text="Excellent" From="80" To="100"/>
                                    </vc:CustomAxisLabels.Labels>
                                </vc:CustomAxisLabels>
                            </vc:Axis.CustomAxisLabels>

                        </vc:Axis>
                    </vc:Chart.AxesY>

                </vc:Chart>

            </StackPanel>
        </Grid>
    </Grid>

</Page>
4.2、后台
using System;
using System.Collections.Generic;
using System.IO;
using System.Linq;
using Windows.Foundation;
using Windows.Foundation.Collections;
using Windows.UI.Xaml;
using Windows.UI.Xaml.Controls;
using Windows.UI.Xaml.Controls.Primitives;
using Windows.UI.Xaml.Data;
using Windows.UI.Xaml.Input;
using Windows.UI.Xaml.Media;
using Windows.UI.Xaml.Navigation;
using Visifire.Charts;
using Windows.UI;

// The Blank Page item template is documented at http://go.microsoft.com/fwlink/?LinkId=234238

namespace IndicatorsInMultipleChartsForWindows8Metro
{
    /// <summary>
    /// An empty page that can be used on its own or navigated to within a Frame.
    /// </summary>
    public sealed partial class MainPage : Page
    {
        public MainPage()
        {
            this.InitializeComponent();

            CreateChart(Chart1, RenderAs.Line, 1, false);
            CreateChart(Chart2, RenderAs.Column, 1, true);

            Chart1.PlotArea = new PlotArea();
            Chart2.PlotArea = new PlotArea();

            Chart1.PlotArea.PointerMoved += PlotArea1_PointerMoved;
            Chart1.PlotArea.PointerExited += PlotArea1_PointerExited;

            Chart2.PlotArea.PointerMoved += PlotArea2_PointerMoved;
            Chart2.PlotArea.PointerExited += PlotArea2_PointerExited;
        }

        /// <summary>
        /// MouseMove event handler, it will enabled ShowIndicator for Chart2
        /// </summary>
        /// <param name="sender"></param>
        /// <param name="e"></param>

        void PlotArea1_PointerMoved(object sender, PlotAreaPointerEventArgs e)
        {
            Chart2.ShowIndicator(e.XValue, e.YValue);
        }

        /// <summary>
        /// MouseLeave event handler, it will disabled ShowIndicator for Chart2
        /// </summary>
        /// <param name="sender"></param>
        /// <param name="e"></param>

        void PlotArea1_PointerExited(object sender, PointerRoutedEventArgs e)
        {
            Chart2.HideIndicator();
        }

        /// <summary>
        /// MouseMove event handler, it will enabled ShowIndicator for Chart1
        /// </summary>
        /// <param name="sender"></param>
        /// <param name="e"></param>

        void PlotArea2_PointerMoved(object sender, PlotAreaPointerEventArgs e)
        {
            Chart1.ShowIndicator(e.XValue, e.YValue);
        }

        /// <summary>
        /// MouseLeave  event handler, it will disabled ShowIndicator for Chart1
        /// </summary>
        /// <param name="sender"></param>
        /// <param name="e"></param>

        void PlotArea2_PointerExited(object sender, PointerRoutedEventArgs e)
        {
            Chart1.HideIndicator();
        }

        /// <summary>
        /// Function to create a chart
        /// </summary>
        public void CreateChart(Chart chart, RenderAs renderAs, Double opacity, Boolean isRondom)
        {
            chart.ScrollingEnabled = false;

            // Create a new instance of DataSeries
            DataSeries dataSeries1 = new DataSeries();
            dataSeries1.ToolTipText = "XValue=#XValue\nYValue=#YValue";
            dataSeries1.MarkerEnabled = false;

            if (renderAs == RenderAs.Line)
            {
                dataSeries1.Color = new SolidColorBrush(Colors.White);
                dataSeries1.LightingEnabled = false;
            }
            else
            {
                dataSeries1.RadiusX = new CornerRadius(2);
                dataSeries1.RadiusY = new CornerRadius(2);
            }

            // Set DataSeries property
            dataSeries1.RenderAs = renderAs;
            dataSeries1.Opacity = opacity;
            dataSeries1.Bevel = false;

            // Create a DataPoint
            DataPoint dataPoint1;

            Double degree = 0;

            for (int i = 0; i < 30; i++)
            {
                // Create a new instance of DataPoint
                dataPoint1 = new DataPoint();

                // Set YValue for a DataPoint
                if (isRondom)
                {
                    dataPoint1.YValue = rand.Next(1, 100);
                }
                else
                {
                    if (i == 0)
                        dataPoint1.YValue = 0;
                    else
                        dataPoint1.YValue = (Int32)(100 * Math.Sin(degree % Math.PI));
                }

                degree += 0.06;

                if (i == 0 || i == 4 || i == 10 || i == 18 || i == 29 || i == 35 || i == 45 || i == 50)
                {
                    if (renderAs == RenderAs.Line)
                    {
                        dataPoint1.MarkerEnabled = true;
                        dataPoint1.MarkerSize = 8;
                        dataPoint1.MarkerColor = dataPoint1.Color;
                    }
                }

                // Add dataPoint to DataPoints collection
                dataSeries1.DataPoints.Add(dataPoint1);
            }

            // Add dataSeries to Series collection.
            chart.Series.Add(dataSeries1);
            chart.IndicatorEnabled = true;
        }

        Random rand = new Random(DateTime.Now.Millisecond);
    }
}
4.3、效果


 1万+
1万+

 被折叠的 条评论
为什么被折叠?
被折叠的 条评论
为什么被折叠?
 到【灌水乐园】发言


