


Azure Monitor 可以用于收集、分析和处理来自云与本地环境的遥测数据的综合解决方案,支持将应用程序和服务的可用性最大化。帮助企业了解应用程序的性能,并主动识别影响应用程序及其所依赖资源的问题。
Azure Monitor 作为云上监控服务,通过为用户提供指标、日志、应用见解以及告警等多种功能,方便用户对数据以及日志进行监控以及查询。其中对操作系统的指标监控,几乎是每一个 Azure 用户都会用到的功能。本篇我们将邀请微软云解决方案架构师为大家介绍,如何使用 Azure Monitor 快速构建 OS 内部指标监控平台。
Azure Monitor 配置自定义指标说明
很多企业可能有注意到,默认情况下,Azure Monitor 其实看不到磁盘和内存的指标。其实这主要是因为 Azure 产品的设计理念:将安全放在首位。内存和磁盘这类指标在虚拟化层取不到,我们给客户分配了多大的内存,操作系统就实实在在拥有了多大的内存,但操作系统内给程序分配多少内存,还剩多少空闲内存,这些信息都属于系统内部的信息,Azure 不会主动去抓取客户的任何数据,因此我们无法探知到客户操作系统内的内存使用情况,除非客户主动将这些信息发布到 Azure 监控平台。当客户将内存信息发布到 Azure 上的时候,这就相当于发布了自定义指标,不在 Azure 标准服务指标之内,Azure 后台要存储这些数据点,尤其是有成千上万的客户,每个客户每一秒钟都有成百上千的机器发布各种指标,这些信息对于 Azure 后台的服务器也产生了很大的压力,需要大量的服务器存储和处理这类新增数据,因此这种指标是收费的。
那么对于像磁盘以及内存等这种常用的指标,是否有比较简单的办法将其发布到 Azure Monitor 中呢?答案是肯定的。借助于Azure VM的Diagnostic settings(诊断设置)功能,用户可以轻松将 Windows 或 Linux 的指标发送到 Azure Monitor 上,之后在Azure Monitor 的 Portal 中就可以直接看到。但需要注意的是:该指标实际上是存储在 Azure Storage Account 的 Table Store 中,虽然 Azure Monitor Portal 上可以看到这个指标,但通过 Azure Monitor 的 API 查询不到自定义指标(REST API 和 Azure CLI均查不到,其他 SDK 也一样)。为了能够查询到内存和磁盘的指标,Windows VM 可以在配置 Diagnostics settings 的时候启用 Sinks 功能,将自定义指标保存到 Azure Monitor 服务中;Linux VM 需要配置 telegraf 来发送指标。
Windows VM 指标发送到 Azure Monitor
接下来,我们为大家演示,如何将 Windows VM 的指标发送到 Azure Monitor:
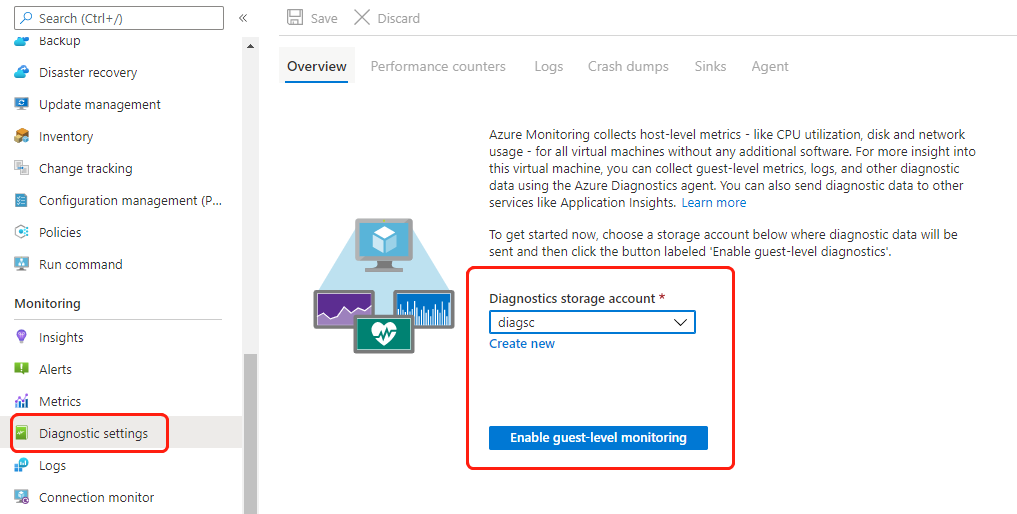
1. 在 VM 的”Diagnostic settings”界面,选择或创建一个存储账号,然后点击 “Enable guest-level monitoring”.
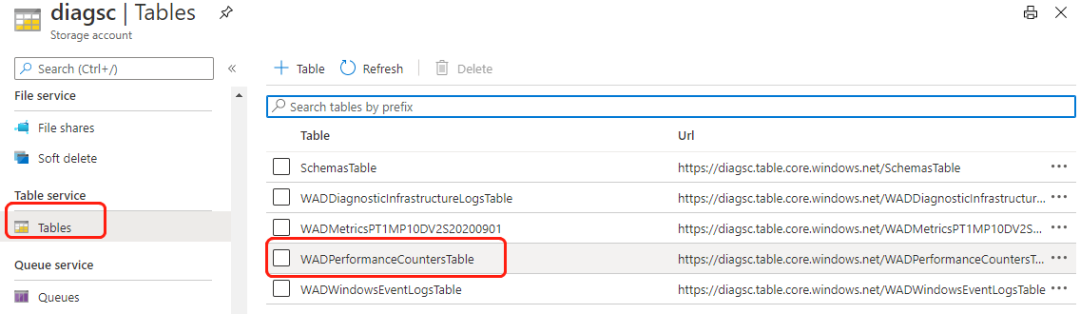
2. 之后在 Azure Monitor Metrics 里面,可以看到 Metric Namespace 中多了一个叫做 “Guest(classic)”的命名空间,在此命名空间中,可以看到操作系统内部细粒度的指标。但是此时,使用Azure CLI或者API查询Azure Monitor Metrics,并不能得到对应的指标。此时在 Storage Account 的 Table Store 中,可以看到多了几张表,刚看到的 Metrics 则存放在“WADPerformanceCountersTable”这张表中
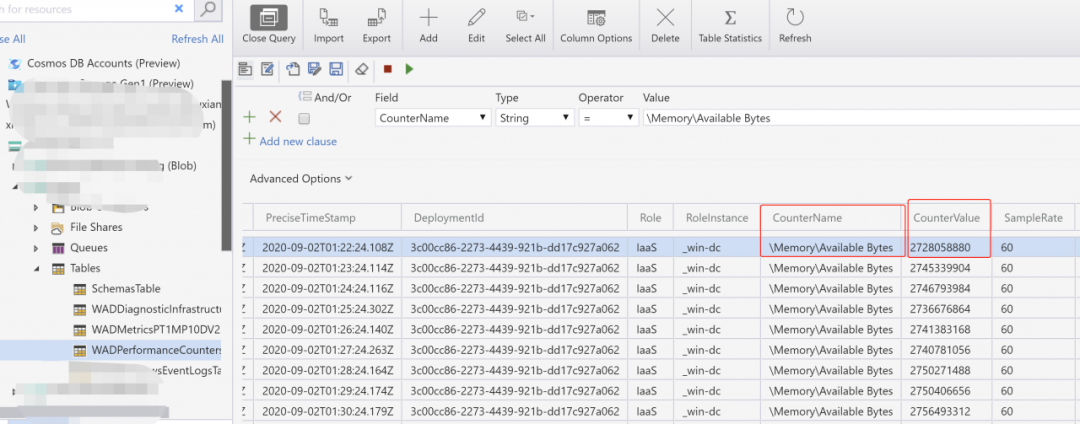
3. 通过 Table Store 的 API 接口或使用 Storage Explorer 查询这张表,就可以获得对应的指标值
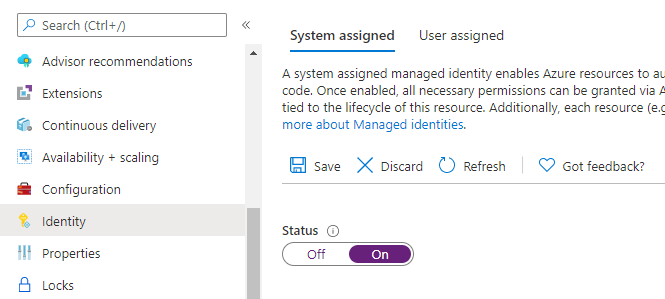
4. 但如果想要通过 Azure Monitor 的接口进行查询呢?我们就需要对 Windows VM 配置 Sinks 功能。在配置 Sinks 之前,需要先给 VM 添加一个 Managed Identity,这样 VM 才有权限访问到 Azure Monitor 服务。
给 VM 配置 Identity 非常简单,在 VM 的 Identity 界面,将 Status 设置为 On 就可以了。
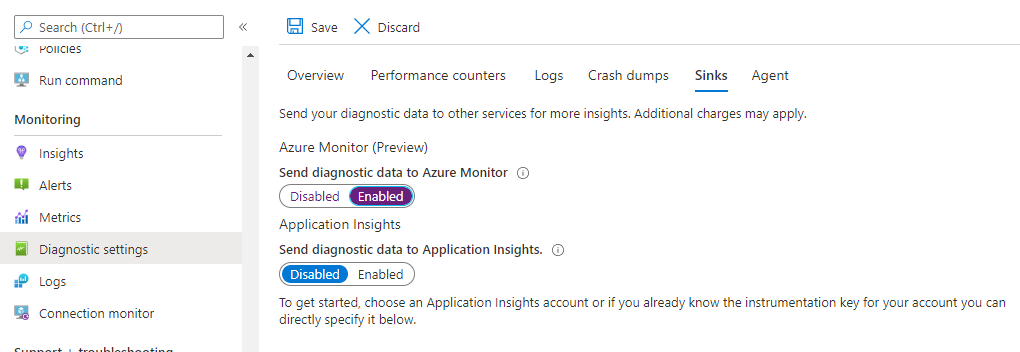
5. 之后在”Diagnostic settings”中,将”Send diagnostic data to Azure Monitor” 设置为 “Enabled” (如有需要,也可以启用 “Send diagnostic data to Application Insights”),之后点击保存
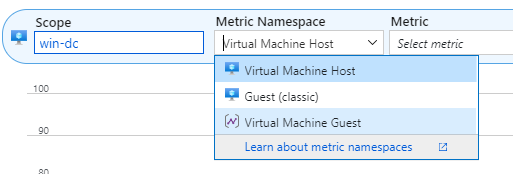
6. 启用向 Azure Monitor 发送诊断数据之后,在 Metric Namespace 中会多一个 “Virtual Machine Guest”的命名空间,这个命名空间下的指标数据可以通过 Azure Monitor 的 API 查询。
7. 通过 Azure CLI 查询 VM 的 System/Process 进程数
az monitor metrics list --resource /subscriptions/{SubscriptionID}/resourceGroups/wins/providers/Microsoft.Compute/virtualMachines/win-dc --start-time 2020-09-02T02:00:00Z --end-time 2020-09-02T02:04:00Z --interval PT1M --namespace 'Azure.VM.Windows.GuestMetrics' --metric "System\Processes"
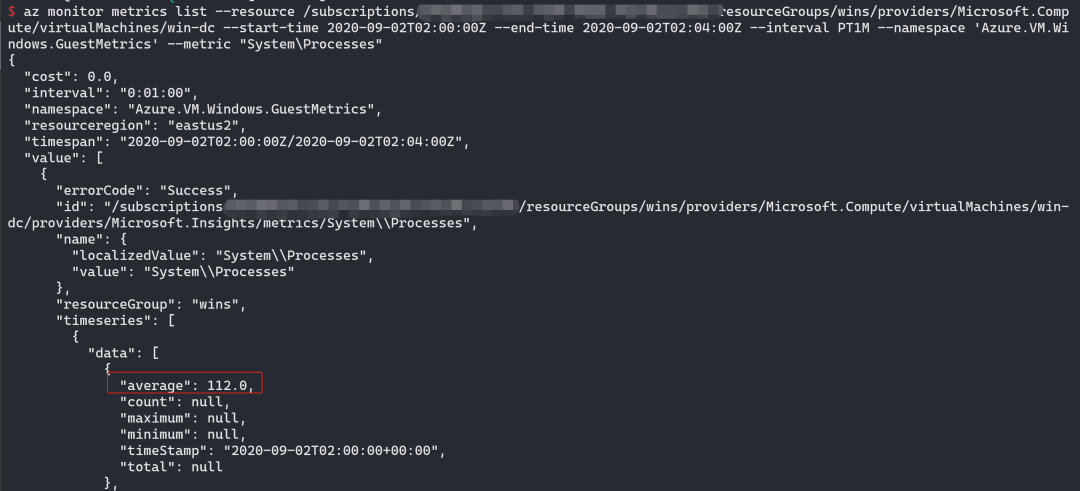
Windows Diagnostics settings 的 namespace 名字为"Azure.VM.Windows.GuestMetrics",该命名空间可以通过下面的 REST API 获得:
GET
Linux VM 的指标发送到 Azure Monitor
对于 Linux VM,大家会发现在”Diagnostic settings”界面,并没有 Sinks 功能。我们可以通过在操作系统内安装 telegraf 软件,并在 VM 上配置 Identity(和上述 Windows VM 配置一样,本次不再赘述),之后 telegraf 就会将操作系统内部指标发送到 Azure Monitor 上。
以 Ubuntu 18.04为例,安装和配置 Telegraf 的过程如下:
1. 登录到 Ubuntu 操作系统,下载并安装 telegraf 软件
# download the package to the VM
wget https://dl.influxdata.com/telegraf/releases/telegraf_1.8.0~rc1-1_amd64.deb
# install the package
sudo dpkg -i telegraf_1.8.0~rc1-1_amd64.deb
2. 默认情况下,telegraf 的配置文件存放在 /etc/telegraf/telegraf.conf,您也可以自定义这个文件,比如创建一个统计 cpu 和内存指标的配置文件
# generate the new Telegraf config file in the current directory
telegraf --input-filter cpu:mem --output-filter azure_monitor config > azm-telegraf.conf
# replace the example config with the new generated config
sudo cp azm-telegraf.conf /etc/telegraf/telegraf.conf
3. 重启一下 teletraf 服务,使其应用最新的配置文件
# stop the telegraf agent on the VM
sudo systemctl stop telegraf
# start the telegraf agent on the VM to ensure it picks up the latest configuration
sudo systemctl start telegraf
完成上述操作后,在 Azure Monitor 中即可看到都了两个 Namespace,分别为 “telegraf/mem”和 “telegraf/cpu”,我们可以在 Azure Portal 上查看对应的指标值。同样,我们也可以利用 Azure Monitor 的 API 或 CLI 命令进行查询。
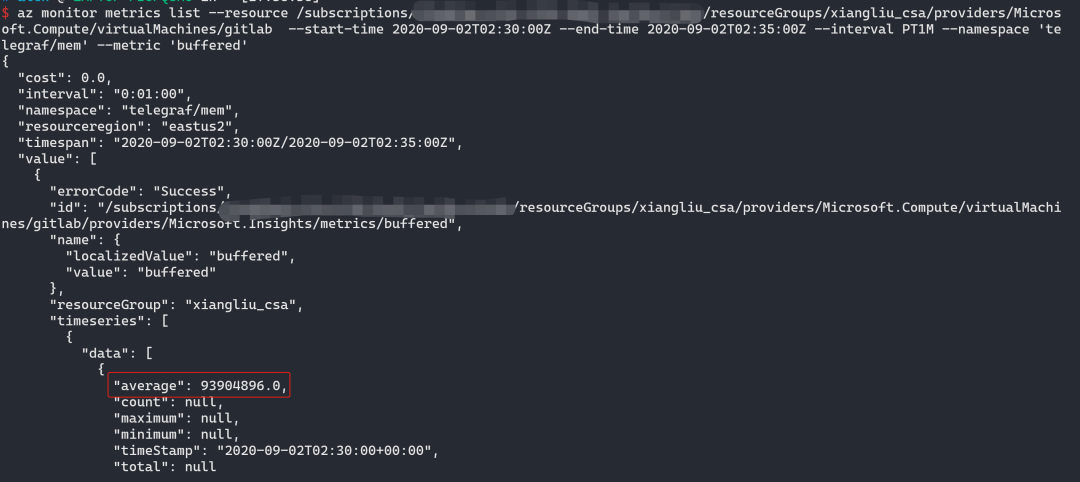
示例:查询 Linux VM 内存 buffered 值
az monitor metrics list --resource /subscriptions/{SubscriptionID}/resourceGroups/xiangliu_csa/providers/Microsoft.Compute/virtualMachines/gitlab --start-time 2020-09-02T02:30:00Z --end-time 2020-09-02T02:35:00Z --interval PT1M --namespace 'telegraf/mem' --metric 'buffered'
小结
Azure 提供了各种丰富的云资源,并针对各种服务提供了多种插件,大家在使用的时候可以借助这些云原生的服务及插件来快速构建自己的系统。事实上,Azure Monitor 也可以与很多第三方工具集成,如 Grafana, ELK, DataDog, LogicMonitor 等。本文只揭开了 Azure Monitor 功能的冰山一角,大家也可以点击此处,浏览Azure Monitor官方技术文档,了解更多信息。


 665
665


 被折叠的 条评论
为什么被折叠?
被折叠的 条评论
为什么被折叠?
 到【灌水乐园】发言


