


阅读文本大概需要3分钟。
ELK+Filebeat的流程应该是这样的:Filebeat->Logstash->(Elasticsearch<->Kibana)由我们自己的程序产生出日志,由Filebeat进行处理,将日志数据输出到Logstash中,Logstash再将数据输出到Elasticsearch中,Elasticsearch再与Kibana相结合展示给用户。
Elasticsearch: 能对大容量的数据进行接近实时的存储,搜索和分析操作。
Logstash: 数据收集引擎,它支持动态的的从各种数据源获取数据,并对数据进行过滤,分析,丰富,统一格式等操作,然后存储到用户指定的位置。
Kibana: 数据分析与可视化平台,对Elasticsearch存储的数据进行可视化分析,通过表格的形式展现出来。
Filebeat: 轻量级的开源日志文件数据搜集器。通常在需要采集数据的客户端安装Filebeat,并指定目录与日志格式,Filebeat就能快速收集数据,并发送给logstash进行解析,或是直接发给Elasticsearch存储
0x01: ElasticSearch 搭建
首先 在local下面创建elk目录 然后下载elasticsearch,logstash,kibana
cd usr/localmkdir elkwget https://artifacts.elastic.co/downloads/elasticsearch/elasticsearch-6.6.0.tar.gzwget https://artifacts.elastic.co/downloads/kibana/kibana-6.6.0-linux-x86_64.tar.gzwget https://artifacts.elastic.co/downloads/logstash/logstash-6.6.0.tar.gz
解压
tar -xzvf elasticsearch-6.6.0.tar.gz -C /usr/local/elktar -xzvf logstash-6.6.0.tar.gz -C /usr/local/elktar -xzvf kibana-6.6.0-linux-x86_64.tar.gz
root用户建议不直接启动es
# 增加或更改以下内容[root@master-node ~]# vim /etc/elasticsearch/elasticsearch.yml
查看后台命令是否启动成功
ps aux|grep elasticsearch
这是出于系统安全考虑设置的条件。由于ElasticSearch可以接收用户输入的脚本并且执行,为了系统安全考虑,建议创建一个单独的用户用来运行ElasticSearch。创建elsearch用户组及elsearch用户。
groupadd elsearch
组名 密码
useradd elsearch -g elsearch -p elk
更改elasticsearch文件夹及内部文件的所属用户及组为elsearch:elsearch。用root用户执行 : chown -R 用户名 文件夹名
chown -R elsearch:elsearch elasticsearch-6.6.0
其中elasticsearch-6.6.0为elasticsearch的目录名称,切换到elsearch用户再启动
su elsearch #切换账户
cd elasticsearch/bin #进入你的elasticsearch目录下的bin目录
./elasticsearch
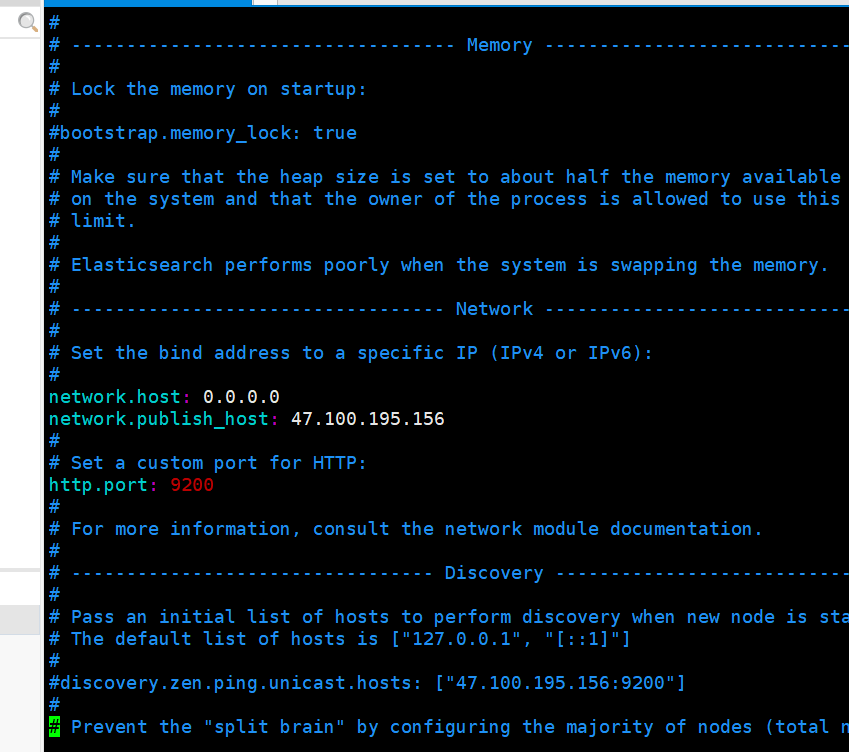
elasticsearch.yml 文件用于配置集群节点等相关信息的
cluster.name: master-node # 集群中的名称
node.name: master # 该节点名称
node.master: true # 意思是该节点为主节点
node.data: false # 表示这不是数据节点
network.host: 0.0.0.0 # 监听全部ip,在实际环境中应设置为一个安全的ip
http.port: 9200 # es服务的端口号
discovery.zen.ping.unicast.hosts:["192.168.77.128","192.168.77.130", "192.168.77.134"] # 配置自动发现
ElasticSearch后台启动命令
[root@master-node ~]# ./elasticsearch
[root@master-node ~]# curl http://127.0.0.1:9200/
[root@master-node ~]# nohup ./bin/elasticsearch&
异常:
max virtual memory areas vm.max_map_count [65530]is too low, increase to at least [262144vim etc/sysctl.confvm.max_map_count=262144sysctl -p
命令:
sysctl -a|grep vm.max_map_count
显示:
vm.max_map_count = 262144
异常:
max file descriptors [4096] for elasticsearch process is too low, increase to at least [65536
#切换到root用户修改
vim /etc/security/limits.conf
# 在最后面追加下面内容
*** hard nofile 65536
*** soft nofile 65536
elasticsearch要进行外网访问,需要修改config目录下elasticsearch.yml文件,
network.publish_host: 外网ip地址
network.host: 0.0.0.0 全网ip
查询端口是否有进程守护用如下命令grep对应端口,如9200为端口号
例:netstat -nalp | grep 9200
注意顺序,network.host 放上面,但是外网是访问不了的。如果要配置成外网。需要把 network.publish_host : 配置成外网ip 即可。在阿里云上配置对外的开放的9200端口号
安装elasticsearch -head 插件
wget https://nodejs.org/dist/v10.15.1/node-v10.15.1-linux-x64.tar.xztar xvf node-v10.15.1-linux-x64.tar.xzwget https://github.com/mobz/elasticsearch-head/archive/master.zipunzip master.zipexport NODE_PATH=/usr/local/node/node-v10.15.1-linux-x64export PATH=$PATH:$JAVA_HOME/bin:$NODE_PATH/bin
.配置head, 进入head文件中。执行
npm install -g grunt-cli
执行 npm install ,此过程会下载phantomjs (运行npm install时,可能PhantomJS not found on PATH ...可执行 npm install latest)
修改 elasticsearch/config/elasticsearch.yml
http.cors.enabled: true
http.cors.allow-origin: "*"
修改elasticsearch-head下的Gruntfile.js
#其中增加一个
cd /usr/local/es/elasticsearch-head/_site/
vim app.js
打开文件 在命令行模式输入 “/this.base_uri” 进行搜索,然后修改为
this.base_uri = this.config.base_uri || this.prefs.get("app-base_uri") || "http://you ip address:9200";
启动elasticsearch
/usr/local/es/node-1/bin/elasticsearch -d
启动elasticsearch-head服务
/usr/local/es/elasticsearch-head/node_modules/grunt/bin/grunt server
如果要后台启动
nohup /usr/local/es/elasticsearch-head/node_modules/grunt/bin/grunt server & exit
0x02:Logstash配置
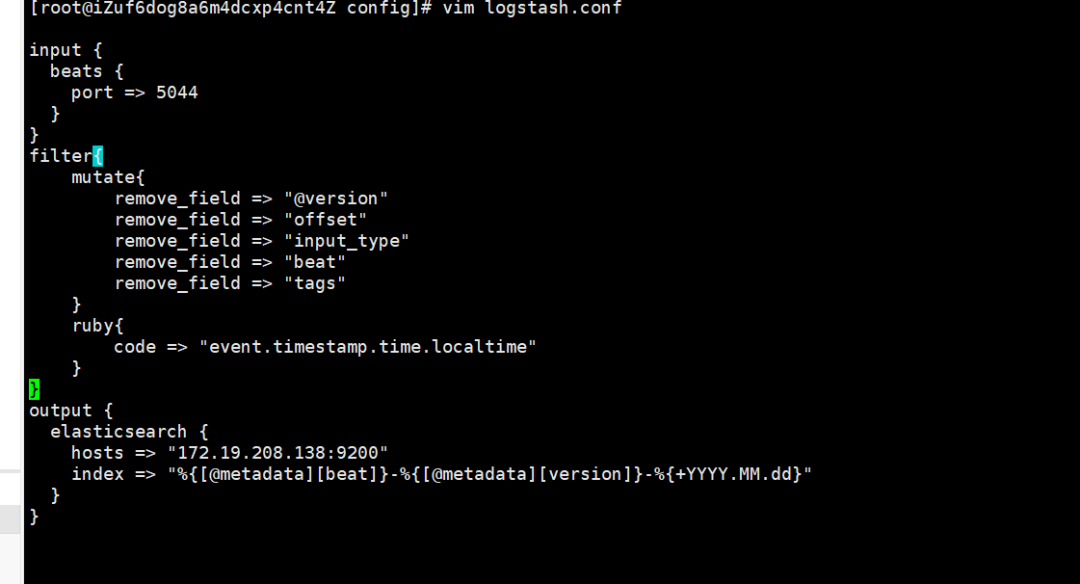
Logstash其实就是一个收集器,使用时需要为它指定Input和Output(Input和Output可以为多个)。比如若把Java代码中Log4j的日志输出到ElasticSearch中,Input就是Log4j,而Output就是ElasticSearch。配置文件,这里配置输入filebeat.输出到ElasticSearch。
# bin/logstash -e 'input{stdin{}}output{stdout{codec=>rubydebug}}'
然后随意输入hello 回车,然后看看返回结果。
bin目录新建 logstash.conf。然后通过 bin/logstash -f logstash.conf 这样的形式来运行。此外,logstash 还提供一个方便我们规划和书写配置的小功能。可以直接用 bin/logstash -f /etc/logstash.d/ 来运行。logstash 会自动读取 /etc/logstash.d/ 目录下所有 *.conf 的文本文件,然后在自己内存里拼接成一个完整的大配置文件,再去执行。新建 logstash.conf
遇到的问题:
(/usr/local/elk/elasticsearch-6.6.0/logs/master-node.log) java.io.FileNotFoundException:
/usr/local/elk/elasticsearch-6.6.0/logs/master-node.log (Permission denied) java.io.FileNotFoundException: /usr/local/elk/elasticsearch-6.6.0/logs/master-node.log (Permission denied)
修改log日志文件的所属权【选操作,如果已经是要启动的用户,则无视】
修改logs/master-node.log
chown elsearch master-node.log
chgrp elsearch master-node.log
异常 IllegalStateException
Caused by: java.lang.IllegalStateException: failed to obtain node locks, tried [[/opt/elasticsearch-5.5.2/data/ymq]] with lock id [0]; maybe the
删除安装目录下/data
rm -rf nodes
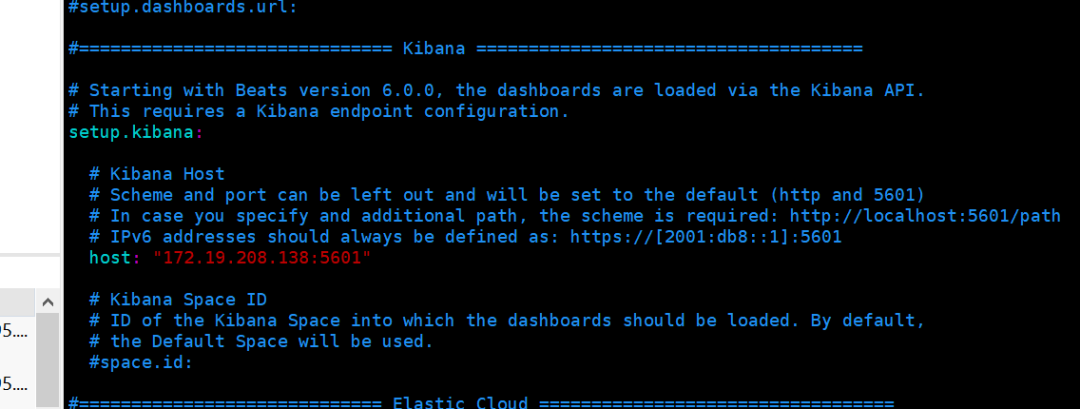
0x03: Kibana
配置文件, 在kibana的config目录下kibana.yml
# Kibana is served by a back end server. This setting specifies the port to use.server.port: 5601# To allow connections from remote users, set this parameter to a non-loopback address.server.host: "localhost"# The URL of the Elasticsearch instance to use for all your queries.# 这里配置的Elasticsearch的链接地址elasticsearch.url: "http://192.168.2.12:9200"# Kibana uses an index in Elasticsearch to store saved searches, visualizations and# dashboards. Kibana creates a new index if the index doesn't already exist.kibana.index: ".kibana"
0x04: filebeats 安装
wget https://artifacts.elastic.co/downloads/beats/filebeat/filebeat-6.6.0-linux-x86_64.tar.gztar -zxvf filebeat-6.6.0-linux-x86_64.tar.gz
filebeat配置:
cd usr/local/elk/filebeat-6.6.0/
vim filebeat.yml
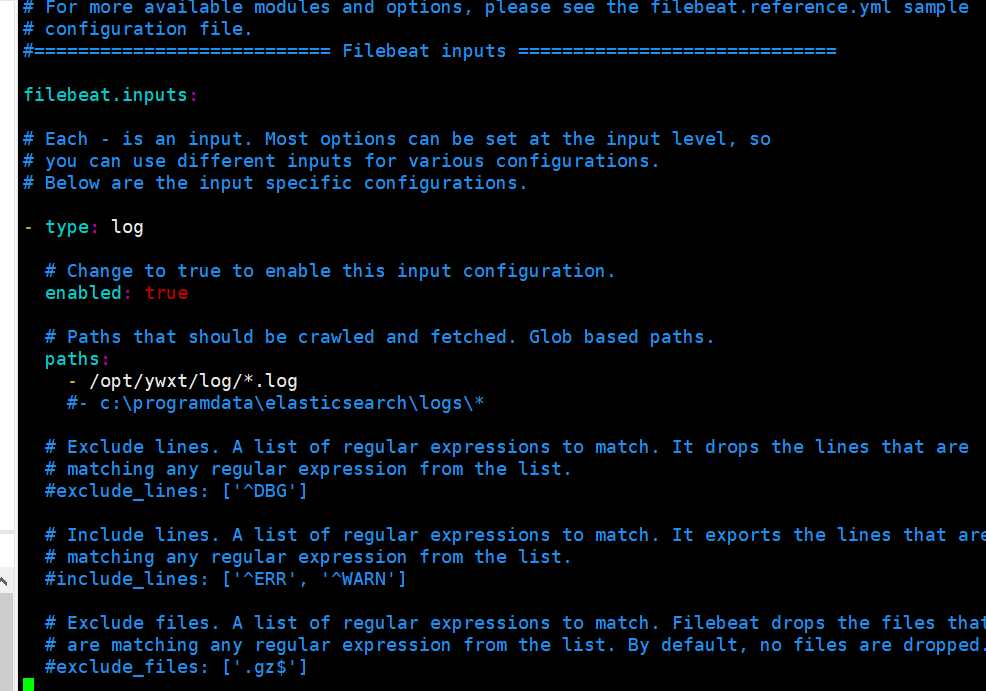
修改配置filebeat.yml:
- input_type: log
# Paths that should be crawled and fetched. Glob based paths.
paths:
- /var/log/*.log
- /opt/ywxt/log/*.log #修改扫描输入路径(可以配置多个路径)
屏蔽elasticsearch 配置
当filebeats配合logstash使用,需要手动load the index template in ElasticSearch,就是filberts直连ElasticSearch load 数据,命令如下:
./filebeat setup --template -E output.logstash.enabled=false -E 'output.elasticsearch.hosts=["172.19.208.138:9200"]
启动:
./filebeat -e -c filebeat.yml
默认的Elasticsearch需要的index template在安装Filebeat的时候已经提供,路径为/etc/filebeat/filebeat.template.json,可以使用如下命令装载该模板:
$ curl -XPUT 'http://localhost:9200/_template/filebeat?pretty' -d@/etc/filebeat/filebeat.template.json
当然,也不能忘了,每次修改完Filebeat的配置后,需要重启Filebeat才能让改动的配置生效。
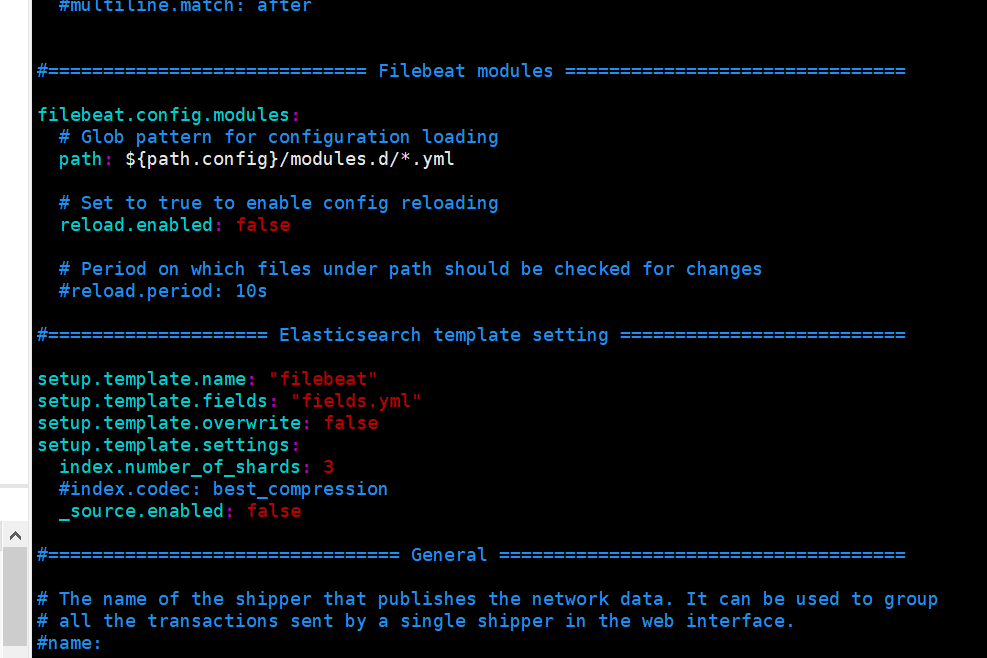
修改filebeat配置
setup.template.name: "filebeat"setup.template.fields: "fields.yml"setup.template.overwrite: falsesetup.template.settings:_source.enabled: false
Filebeat附带了示例Kibana仪表板,可视化和搜索,以便在Kibana中可视化Filebeat数据。在使用仪表板之前,需要创建索引模式filebeat-*,并将仪表板加载到Kibana中。为此,您可以运行setup命令(如此处所述)或在配置文件中配置仪表板加载filebeat.yml。(我这里暂时选用此种方式)
filebeat setup --dashboards
../bin/logstash -f logstash.conf
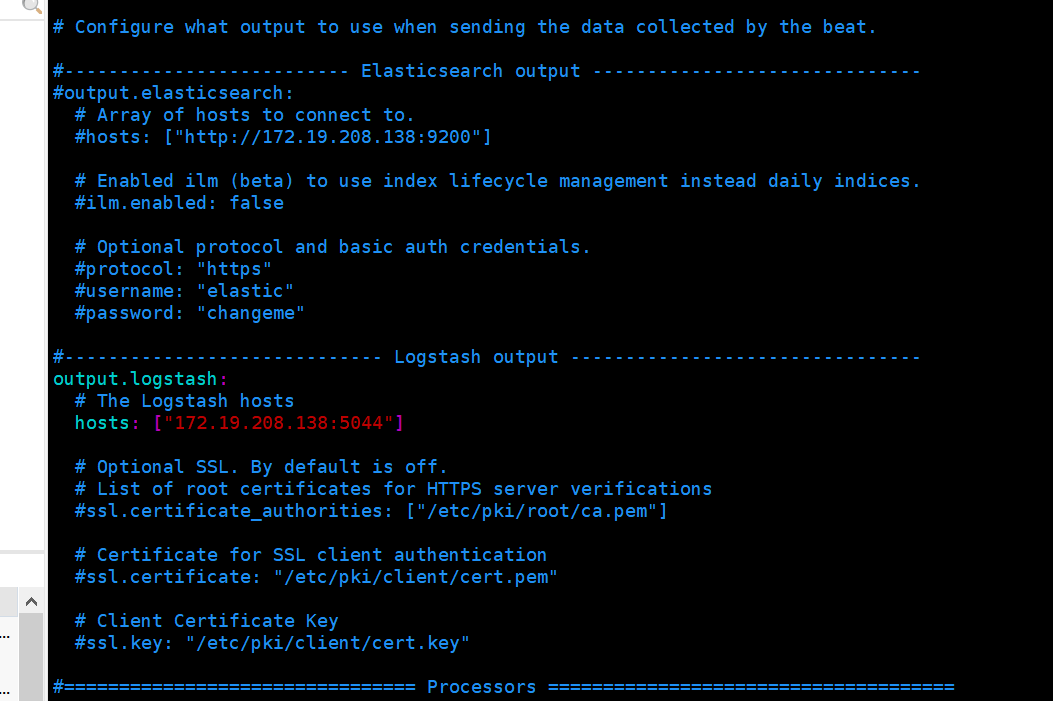
这需要注意默认是开启es的,注释掉,配置logstsah
☆
往期精彩
☆
关注我每天进步一点点


你点的在看,我都当成了喜欢


 5030
5030


 被折叠的 条评论
为什么被折叠?
被折叠的 条评论
为什么被折叠?
 到【灌水乐园】发言


