项目需要在WINCE设备中显示曲线图,由于wince采集器默认是不带画图的动态库的,所以在网上找了一个动态库(XrossGDIPlus)来画图,关于XrossGDIPlus具体参考http://www.microsoft.com/china/msdn/library/NetFramework/netcompactframework/dnnetcompXrossOne.mspx?mfr=true。 这个曲线是用路径显示的,画完曲线后,还要画显示的坐标,原来的XrossGDIPlus库稍微做了调整,将XrossGDIPlus的缓冲图片暴露出来进行绘制坐标,只有七个点以上才支持使用贝兹曲线进行显示,否则进行直线显示,为什么如此,未找到XrossGDIPlus的原因,如果有明白的,请指点一下
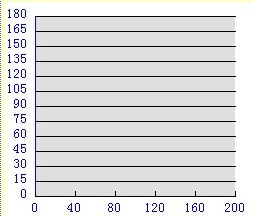
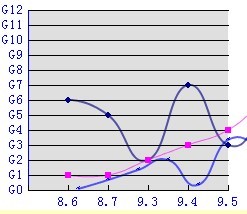
设计期效果图如下,坐标轴的显示文字,字体颜色大小,坐标轴颜色都是可以设置的。
运行期的曲线效果图:显示在坐标区之外了,是因为临时调整截图显示的需要
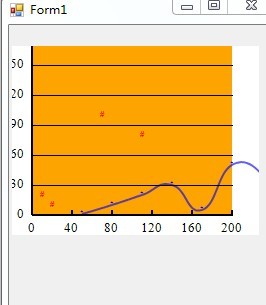
调用方式: Point point1 = new Point(50, 1);
Point point2 = new Point(80, 10);
Point point3 = new Point(110, 20);
Point point4 = new Point(140, 30);
Point point5 = new Point(170, 5);
Point point6 = new Point(200, 50);
Point point7 = new Point(230, 40);
Point[] curvePoints ={
point1,
point2,
point3,
point4,
point5,
point6,
point7
};
int offset = 0;
int numSegments = 6;
float tension = 1f;
// Draw curve to screen.
curve.AddCurve(curvePoints, Color.Blue, 2, new Font(FontFamily.GenericSansSerif, 6, FontStyle.Regular), "*");
curve.BeginCurve();
控件的源代码:using System; using System.Collections.Generic; using System.ComponentModel; using System.Drawing; using System.Data; using System.Text; using System.Windows.Forms; using XrossOne.Drawing; namespace FrontLinkControls { public struct CurveParameter { public Point[] pointList; public Color curveColor; public float curveWidth; public Font curveFont; public string curveAxisHead; } public partial class FrontLinkCurve : UserControl { private GraphicsX gx; public FrontLinkCurve() { InitializeComponent(); gx = new GraphicsX(Width, Height); } private float m_xBlankSize = 50; // 坐标轴左边空白的距离 private float m_yBlankSize = 50; // 坐标轴右边空白的距离 #region 设置坐标轴属性 private float m_YMax = 150; // X轴的长度 private float m_XMax = 200; // Y轴的长度 private float m_XCurveHeight = 5; // X轴曲线的高度 private float m_YUnitSize = 30; // Y轴的刻度单位 private float m_XUnitSize = 40; // X轴的刻度单位 private Color m_CurveBackColor = Color.Orange; // 曲线背景的颜色 private Color m_CurveAxisColor = Color.Black; // 曲线线条的颜色 private float m_CurveXWidth = 0.001f; // x轴曲线的宽度 private float m_CurveYWidth = 0.001f; // y轴曲线的宽度 private Color m_AxisColor = Color.Black; // X,Y坐标轴的颜色 private int m_AxisWidth = 2; // X,Y坐标轴的宽度 private int m_YAxisNameWidth = 5; // Y轴名字的间隔距离 private int m_XAxisNameWidth = 5; // X轴名字的间隔距离 private Font m_YFont = new Font(FontFamily.GenericSerif, 10, FontStyle.Regular); // Y轴的名字字体 private Font m_XFont = new Font(FontFamily.GenericSerif, 10, FontStyle.Regular); // X轴的名字字体 // 用来绘制曲线图的关键点,依次将这些点连接起来即得到曲线图 private List<CurveParameter> m_curve = new List<CurveParameter>(); public float XBlankSize { get { return this.m_xBlankSize; } set { if (value >= 0) { m_xBlankSize = value; Invalidate(); } } } public float YBlankSize { get { return this.m_yBlankSize; } set { if (value >= 0) { m_yBlankSize = value; Invalidate(); } } } public float YMax { get { return this.m_YMax; } set { if (value >= 0) { m_YMax = value; Invalidate(); } } } public float XMax { get { return m_XMax; } set { if (value >= 0) { m_XMax = value; Invalidate(); } } } public float XCurveHeight { get { return m_XCurveHeight; } set { if (value >= 0) { m_XCurveHeight = value; Invalidate(); } } } public float YUnitSize { get { return m_YUnitSize; } set { if (value > 0) { m_YUnitSize = value; Invalidate(); } } } public float XUnitSize { get { return m_XUnitSize; } set { if (value > 0) { m_XUnitSize = value; Invalidate(); } } } public Color CurveBackColor { get { return m_CurveBackColor; } set { m_CurveBackColor = value; Invalidate(); } } public Color CurveAxisColor { get { return m_CurveAxisColor; } set { m_CurveAxisColor = value; Invalidate(); } } public float CurveXWidth { get { return m_CurveXWidth; } set { if (value >= 0) { m_CurveXWidth = value; Invalidate(); } } } public float CurveYWidth { get { return m_CurveYWidth; } set { if (value >= 0) { m_CurveYWidth = value; Invalidate(); } } } public Color AxisColor { get { return m_AxisColor; } set { m_AxisColor = value; Invalidate(); } } public int AxisWidth { get { return m_AxisWidth; } set { if (value >= 0) { m_AxisWidth = value; Invalidate(); } } } public int YAxisNameWidth { get { return m_YAxisNameWidth; } set { if (value >= 0) { m_YAxisNameWidth = value; Invalidate(); } } } public int XAxisNameWidth { get { return m_XAxisNameWidth; } set { if (value >= 0) { m_XAxisNameWidth = value; Invalidate(); } } } public Font YFont { get { return m_YFont; } set { m_YFont = value; Invalidate(); } } public Font XFont { get { return m_XFont; } set { m_XFont = value; Invalidate(); } } // Y轴上的坐标点个数 public int YAxisCount { get{ return (int)(YMax / YUnitSize); } } // X轴上的坐标点个数 public int XAxisCount { get { return (int)(XMax / XUnitSize); } } public void AddCurve(CurveParameter curve) { if (curve.pointList == null || curve.curveColor == null || curve.curveFont == null || curve.curveAxisHead == null) { throw new Exception("参数不能为空"); } if (curve.curveWidth <= 0) { throw new Exception("曲线宽度不能小于零"); } ChangePointList(ref curve.pointList); m_curve.Add(curve); } public void AddCurve(Point[] pointList, Color curveColor, float curveWidth, Font curveFont, string curveAxisHead) { if (pointList == null || curveColor == null || curveFont == null && curveAxisHead == null) { throw new Exception("参数不能为空"); } if (curveWidth <= 0) { throw new Exception("曲线宽度不能小于零"); } CurveParameter curve = new CurveParameter(); curve.pointList = pointList; curve.curveColor = curveColor; curve.curveWidth = curveWidth; curve.curveFont = curveFont; curve.curveAxisHead = curveAxisHead; ChangePointList(ref curve.pointList); m_curve.Add(curve); } private void ChangePointList(ref Point[] pointList) { for (int i = 0; i < pointList.Length; i++) { pointList[i].X = GetXPoint(m_xBlankSize + pointList[i].X); pointList[i].Y = GetYPoint(m_yBlankSize + pointList[i].Y); } } public void ClearCurve() { m_curve.Clear(); } public void BeginCurve() { DrawCurve(); Invalidate(); } #endregion public delegate string YAxisGetNameEvent(int yAxis); /// <summary> /// Y轴坐标点名字 /// </summary> public event YAxisGetNameEvent YAxisGetName = null; public delegate string XAxisGetNameEvent(int xAxis); /// <summary> /// Y轴坐标点名字 /// </summary> public event XAxisGetNameEvent XAxisGetName = null; protected override void OnResize(EventArgs e) { gx = new GraphicsX(Width, Height); base.OnResize(e); Invalidate(); } public new bool Enabled { get { return base.Enabled; } set { base.Enabled = value; Invalidate(); } } private int GetXPoint(float x) { return (int)Math.Ceiling(x); } private int GetYPoint(float y) { return (int)Math.Ceiling(Height - y); } // 重绘制一下,否则刚开始显示黑屏 private bool m_bNeedPaint = true; protected override void OnPaintBackground(PaintEventArgs e) { int xPoint = GetXPoint(m_xBlankSize), yPoint = GetYPoint(m_yBlankSize); int xAxisPoint = GetXPoint(m_xBlankSize + XMax), yAxisPoint = GetYPoint(m_yBlankSize + YMax); /// 重绘大背景 e.Graphics.FillRectangle(new SolidBrush(BackColor), 0, 0, Width, Height); if (m_bNeedPaint) { DrawCurve(); m_bNeedPaint = false; Invalidate(); } return; } protected override void OnPaint(PaintEventArgs e) { // 双缓冲技术,先将所有要画的画在该图片中,再调用GS画出该图片. Graphics g = Graphics.FromImage((System.Drawing.Image)gx.graphics.BufferedImage); DrawAxis(ref g); gx.Flush(e.Graphics, 0, 0); base.OnPaint(e); } private Color FromArgb(int alpha, Color c) { int color = c.ToArgb(); color = (alpha << 24) | (color & 0xFFFFFF); return Color.FromArgb(color); } private void DrawCurve() { gx.Clear(Color.White); gx.ResetTransform(); int xPoint = GetXPoint(m_xBlankSize), yPoint = GetYPoint(m_yBlankSize); int xAxisPoint = GetXPoint(m_xBlankSize + XMax), yAxisPoint = GetYPoint(m_yBlankSize + YMax); /// 曲线背景 gx.FillRectangle(new SolidBrushX(m_CurveBackColor), xPoint, yAxisPoint, xAxisPoint - xPoint, yPoint - yAxisPoint); PenX pen1 = new PenX(Color.Gray, 0.2f); // Draw lines between original points to screen. //gx.DrawLines(pen1, curvePoints); // Create offset, number of segments, and tension. int offset = 0; int numSegments = 6; float tension = 1f; for (int i = 0; i < m_curve.Count; i++) { if (m_curve[i].pointList.Length > 0) { PenX pen = new PenX(FromArgb(0xA0, m_curve[i].curveColor), m_curve[i].curveWidth); // Draw curve to screen. // 只能绘制七个点以上的曲线,七个点之下的只能划直线 if (m_curve[i].pointList.Length>=7) { gx.DrawCurve(pen, m_curve[i].pointList, offset, numSegments, tension); } else { gx.DrawLines(pen, m_curve[i].pointList); } } } } private void DrawAxis(ref Graphics g) { int xPoint = GetXPoint(m_xBlankSize), yPoint = GetYPoint(m_yBlankSize); int xAxisPoint = GetXPoint(m_xBlankSize + XMax), yAxisPoint = GetYPoint(m_yBlankSize + YMax); /// 曲线背景 //g.FillRectangle(new SolidBrush(m_CurveBackColor), xPoint, yAxisPoint, xAxisPoint - xPoint, yPoint - yAxisPoint); /// 绘制坐标轴线条 Pen penAxis = new Pen(m_AxisColor, m_AxisWidth); g.DrawLine(penAxis, xPoint, yPoint, xPoint, yAxisPoint); g.DrawLine(penAxis, xPoint, yPoint, xAxisPoint, yPoint); string axisName = ""; SolidBrush nameBrush = new SolidBrush(ForeColor); int nameAxisHeight = (int)Math.Ceiling(g.MeasureString("梁中林", m_YFont).Height / 2); // y轴 int x, y, unitSize = (int)Math.Ceiling(m_YUnitSize), t; Pen penXAxis = new Pen(m_CurveAxisColor, m_CurveXWidth); for (int i = 0; i <= YMax; i = i + unitSize) { if (YAxisGetName != null) { axisName = YAxisGetName(i); } else { axisName = i.ToString(); } x = xPoint - (int)Math.Ceiling(g.MeasureString(axisName, m_YFont).Width) - m_YAxisNameWidth; // 名字 y = GetYPoint(m_yBlankSize + i); g.DrawString(axisName, m_YFont, nameBrush, x, y - nameAxisHeight); // X轴横线 g.DrawLine(penXAxis, xPoint, y, xAxisPoint, y); } // x轴 unitSize = (int)Math.Ceiling(m_XUnitSize); y = GetYPoint(m_yBlankSize - m_YAxisNameWidth); Pen penYAxis = new Pen(m_CurveAxisColor, m_CurveYWidth); int yAxisTempPoint = GetYPoint(YMax - m_XCurveHeight >= 0 ? m_yBlankSize + m_XCurveHeight : m_yBlankSize + YMax); for (int i = 0; i <= XMax; i = i + unitSize) { if (XAxisGetName != null) { axisName = XAxisGetName(i); } else { axisName = i.ToString(); } t = (int)Math.Ceiling(g.MeasureString(axisName, m_XFont).Width / 2); // 名字 x = GetXPoint(m_xBlankSize + i); g.DrawString(axisName, m_YFont, nameBrush, x - t, y); // Y轴横线 g.DrawLine(penYAxis, x, yAxisTempPoint, x, yPoint); } // 坐标轴曲线焦点 SizeF curveAxisHeadSize = new SizeF(); for (int i = 0; i < m_curve.Count; i++) { if (m_curve[i].curveAxisHead.Length > 0) { curveAxisHeadSize = g.MeasureString(m_curve[i].curveAxisHead, m_curve[i].curveFont); curveAxisHeadSize.Height = curveAxisHeadSize.Height / 2; curveAxisHeadSize.Width = (curveAxisHeadSize.Width) / 2; SolidBrush brush = new SolidBrush(m_curve[i].curveColor); for (int j = 0; j < m_curve[i].pointList.Length; j++) { g.DrawString(m_curve[i].curveAxisHead, m_curve[i].curveFont, brush, m_curve[i].pointList[j].X - curveAxisHeadSize.Width, m_curve[i].pointList[j].Y - curveAxisHeadSize.Height); } } } } } }


 6137
6137


 被折叠的 条评论
为什么被折叠?
被折叠的 条评论
为什么被折叠?
 到【灌水乐园】发言


