


1、设计3D帕累托图的页面
Pareto3D.html:
<!DOCTYPE HTML PUBLIC "-//W3C//DTD HTML 4.01 Transitional//EN">
<html>
  <head>
    <title>FusionCharts Pareto3D</title>

    <meta http-equiv="keywords" content="keyword1,keyword2,keyword3">
    <meta http-equiv="description" content="this is my page">
    <meta http-equiv="content-type" content="text/html; charset=UTF-8">
    <script type="text/javascript" src="../scripts/jquery-2.0.3.js"></script>
    <script type="text/javascript" src="../scripts/Charts/FusionCharts.js"></script>
    <script type="text/javascript">
        $(function(){
              var pareto3D = new FusionCharts( "../scripts/Charts/Pareto3D.swf", "pareto3DId", "100%", "540", "0" );
      		  pareto3D.setXMLUrl("data/pareto3D.xml");
              pareto3D.render("pareto3DChart");
        });
    </script>

  </head>

  <body>
    <div id="pareto3DChart"></div>
  </body>
</html>
2、设计3D 帕累托图的数据源
pareto3D.xml:
<?xml version="1.0" encoding="UTF-8"?>
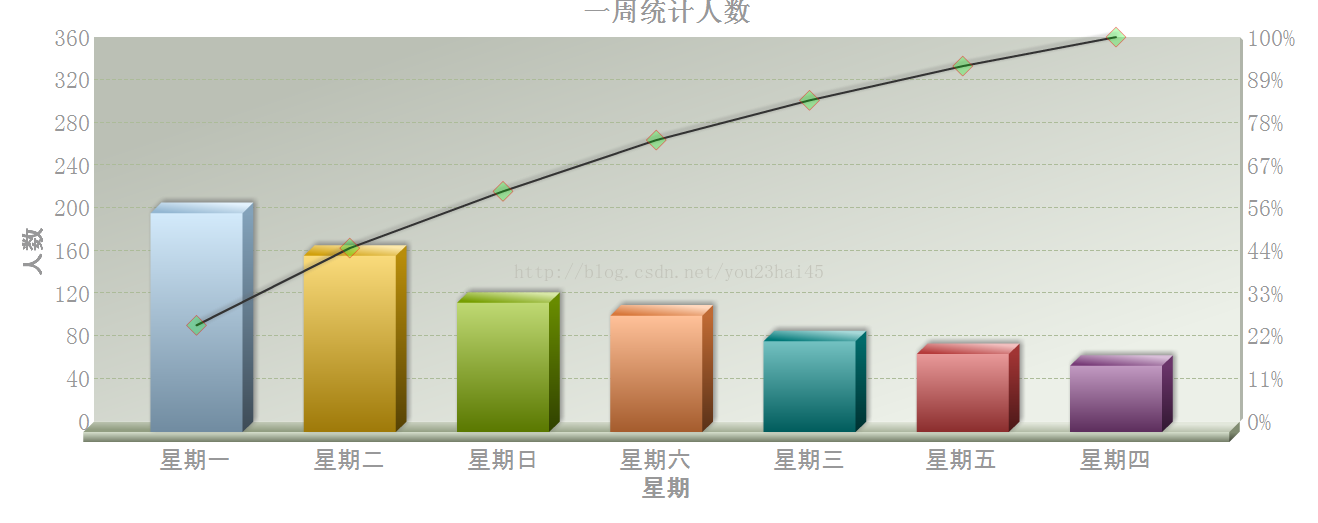
<chart caption="一周统计人数" xAxisName="星期" PYAxisName ="人数" plotGradientColor="" showValues='0'
baseFont='微软雅黑' baseFontSize='20' baseFontColor='#654545' outCnvBaseFont='宋体'
outCnvBaseFontSize='24' outCnvBaseFontColor='#989899' drawAnchors='1' anchorSides='4'
anchorRadius='10' anchorBorderColor='#FF0000' anchorBorderThickness='1' anchorBgColor='#00FF00'
anchorAlpha='50' anchorBgAlpha='50' numDivLines='8' divLineIsDashed='1'>
<set label="星期一" value="205"/>
<set label="星期二" value="165"/>
<set label="星期三" value="85"/>
<set label="星期四" value="62"/>
<set label="星期五" value="73"/>
<set label="星期六" value="109"/>
<set label="星期日" value="121"/>
</chart>3、设计结果


 136
136


 被折叠的 条评论
为什么被折叠?
被折叠的 条评论
为什么被折叠?
 到【灌水乐园】发言


