pcl通过积分图来进行法线预测

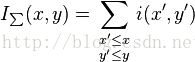
首先,我们来看一下什么是积分图,我查了一下wiki,发现它的定义是这样的。

A summed area table is a data structure and algorithm for quickly and efficiently generating the sum of values in a rectangular subset of a grid. In the image processing domain, it is also known as an integral image. It was introduced to computer graphics in 1984 by Frank Crow for use with mipmaps. In computer vision it was popularized by Lewis[1] and then given the name "integral image" and prominently used within theViola–Jones object detection framework in 2001. Historically, this principle is very well known in the study of multi-dimensional probability distribution functions, namely in computing 2D (or ND) probabilities (area under the probability distribution) from the respective cumulative distribution functions.[2]

一个加法区域表是一个快速计算一个栅格矩形的和的快速有效的数据结构和算法。在图像处理领域,它也叫积分图。/历史我就不说了/ 积分图在多维概率分布用得比较多。

接着看

As the name suggests, the value at any point (xy) in the summed area table is just the sum of all the pixels above and to the left of (xy), inclusive:[3][4]

顾名思义,点(x,y)的像素值是它上面和左边所有的像素值的和。

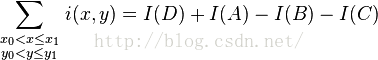
此外,加法区域表在图像里面的某个通道(如RGB图像有3个通道,R,G,B这3个颜色个表示一个通道)的计算是很高效的,下面的这个公式就简单的就行了解释。

Moreover, the summed area table can be computed efficiently in a single pass over the image, using the fact that the value in the summed area table at (xy) is just:

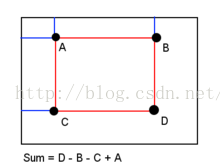
Once the summed area table has been computed, the task of evaluating the intensities over any rectangular area requires only four array references. This allows for a constant calculation time that is independent of the size of the rectangular area. That is, using the notation in the figure at right, having A=(x0, y0), B=(x1, y0), C=(x0, y1) and D=(x1, y1), the sum of i(x,y) over the rectangle spanned by A, B,C and D is:

一旦加法区域计算完成之后,评估然后矩形区域的强度只需要引用4个数组。这使得我们可以得到一个不变的运算次数,和矩形的面积无关。其实那4个数组就是等号右边的那几个被加数,如果不这样的话,越往下,越往右的点的计算次数就越来越大,会大大超过4次。接下去是一张图,不过我们这次算的不是I(D)而是i(x,y)

明白了,以后我们接下去看。

先写一个 normal_estimation_using_integral_images.cpp的cpp文件

     #include <pcl/io/io.h>
     #include <pcl/io/pcd_io.h>
     #include <pcl/features/integral_image_normal.h>
     #include <pcl/visualization/cloud_viewer.h>

     int
     main ()
     {
             // load point cloud
             pcl::PointCloud<pcl::PointXYZ>::Ptr cloud (new pcl::PointCloud<pcl::PointXYZ>);
             pcl::io::loadPCDFile ("table_scene_mug_stereo_textured.pcd", *cloud);

             // estimate normals
             pcl::PointCloud<pcl::Normal>::Ptr normals (new pcl::PointCloud<pcl::Normal>);

             pcl::IntegralImageNormalEstimation<pcl::PointXYZ, pcl::Normal> ne;
             ne.setNormalEstimationMethod (ne.AVERAGE_3D_GRADIENT);
             ne.setMaxDepthChangeFactor(0.02f);
             ne.setNormalSmoothingSize(10.0f);
             ne.setInputCloud(cloud);
             ne.compute(*normals);

             // visualize normals
             pcl::visualization::PCLVisualizer viewer("PCL Viewer");
             viewer.setBackgroundColor (0.0, 0.0, 0.5);
             viewer.addPointCloudNormals<pcl::PointXYZ,pcl::Normal>(cloud, normals);

             while (!viewer.wasStopped ())
             {
               viewer.spinOnce ();
             }
             return 0;
     }

第一步先加载了一个点云文件

pcl::PointCloud<pcl::PointXYZ>::Ptr cloud (new pcl::PointCloud<pcl::PointXYZ>);
pcl::io::loadPCDFile ("table_scene_mug_stereo_textured.pcd", *cloud);

接下去我们建了一个类来预测与计算法线

// estimate normals
pcl::PointCloud<pcl::Normal>::Ptr normals (new pcl::PointCloud<pcl::Normal>);

pcl::IntegralImageNormalEstimation<pcl::PointXYZ, pcl::Normal> ne;
ne.setNormalEstimationMethod (ne.AVERAGE_3D_GRADIENT);
ne.setMaxDepthChangeFactor(0.02f);
ne.setNormalSmoothingSize(10.0f);
ne.setInputCloud(cloud);
ne.compute(*normals);

其中有下面一些预测方法

enum NormalEstimationMethod
{
  COVARIANCE_MATRIX,
  AVERAGE_3D_GRADIENT,
  AVERAGE_DEPTH_CHANGE
};

这个COVARIANCE_MATRIX模型,从最近邻的协方差矩阵创建了9个积分图去计算一个点的法线。AVERAGE_3D_GRADIENT模型创建了6个积分图去计算3D梯度里面竖直和水平方向的光滑部分,同时利用两个梯度的卷积来计算法线。AVERAGE_DEPTH_CHANGE模型创造了一个单一的积分图,从平均深度的变化中来计算法线。

最终我们使他可视化。

// visualize normals
pcl::visualization::PCLVisualizer viewer("PCL Viewer");
viewer.setBackgroundColor (0.0, 0.0, 0.5);
viewer.addPointCloudNormals<pcl::PointXYZ,pcl::Normal>(cloud, normals);

while (!viewer.wasStopped ())
{
  viewer.spinOnce ();
}
  • 0
    点赞
  • 1
    收藏
    觉得还不错? 一键收藏
  • 0
    评论

“相关推荐”对你有帮助么?

  • 非常没帮助
  • 没帮助
  • 一般
  • 有帮助
  • 非常有帮助
提交
评论
添加红包

请填写红包祝福语或标题

红包个数最小为10个

红包金额最低5元

当前余额3.43前往充值 >
需支付:10.00
成就一亿技术人!
领取后你会自动成为博主和红包主的粉丝 规则
hope_wisdom
发出的红包
实付
使用余额支付
点击重新获取
扫码支付
钱包余额 0

抵扣说明:

1.余额是钱包充值的虚拟货币,按照1:1的比例进行支付金额的抵扣。
2.余额无法直接购买下载,可以购买VIP、付费专栏及课程。

余额充值