


今天看到一个画图函数觉得挺有意思的,就试了一下。
直接上代码片段:
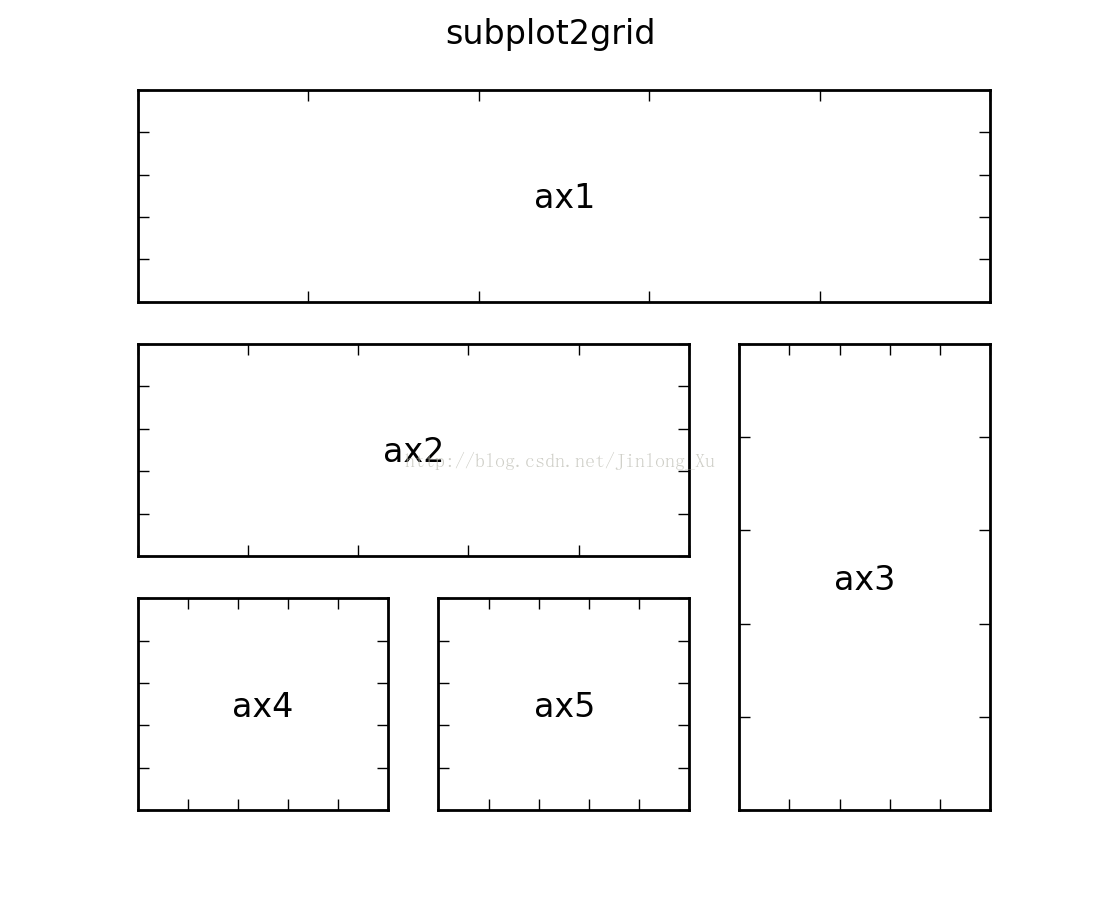
ax1 = plt.subplot2grid((3,3), (0,0), colspan=3)
ax2 = plt.subplot2grid((3,3), (1,0), colspan=2)
ax3 = plt.subplot2grid((3,3), (1, 2), rowspan=2)
ax4 = plt.subplot2grid((3,3), (2, 0))
ax5 = plt.subplot2grid((3,3), (2, 1))
plt.suptitle("subplot2grid")
画出来的图的示意图如下所示:
有时候,我们需要画出来的图更紧凑,面对这样的情况,matplotlib()函数并不能满足我们的需求,subplot2grid()函数可以。


 83
83


 被折叠的 条评论
为什么被折叠?
被折叠的 条评论
为什么被折叠?
 到【灌水乐园】发言


