


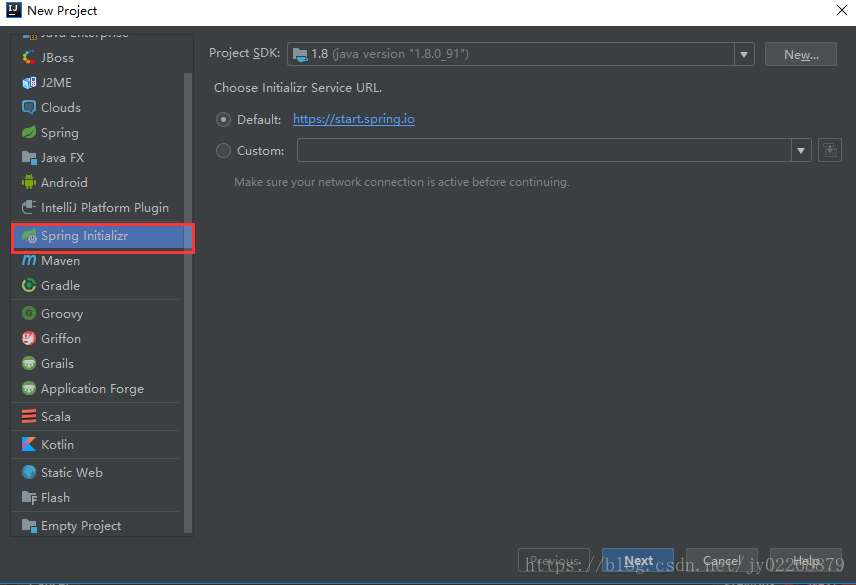
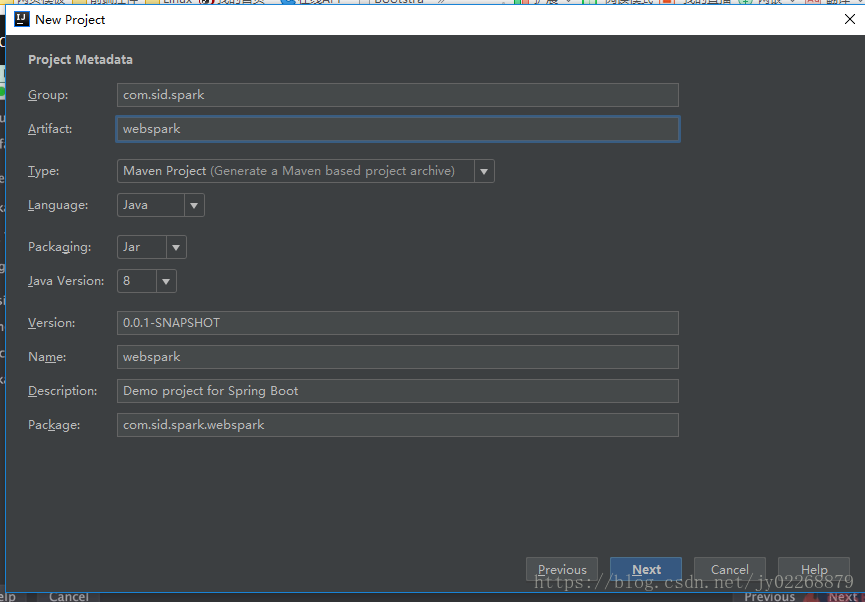
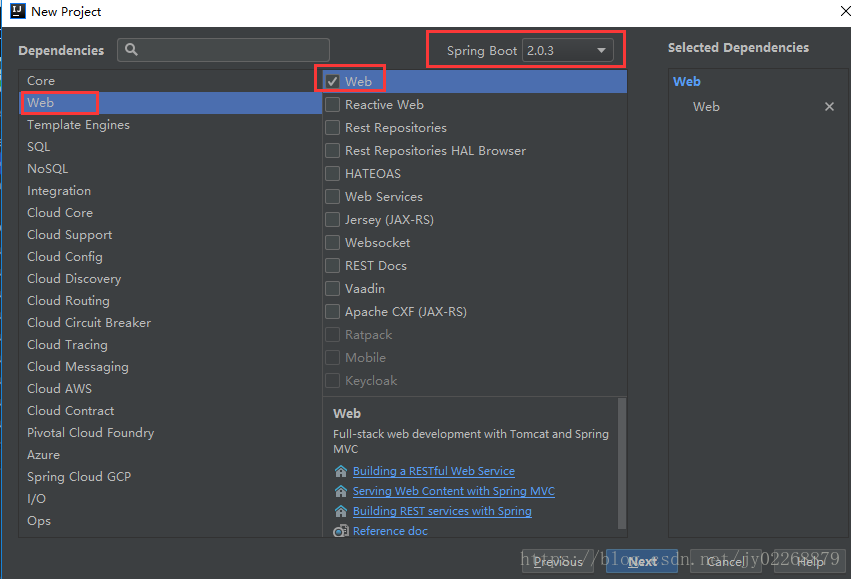
idea创建spring boot项目
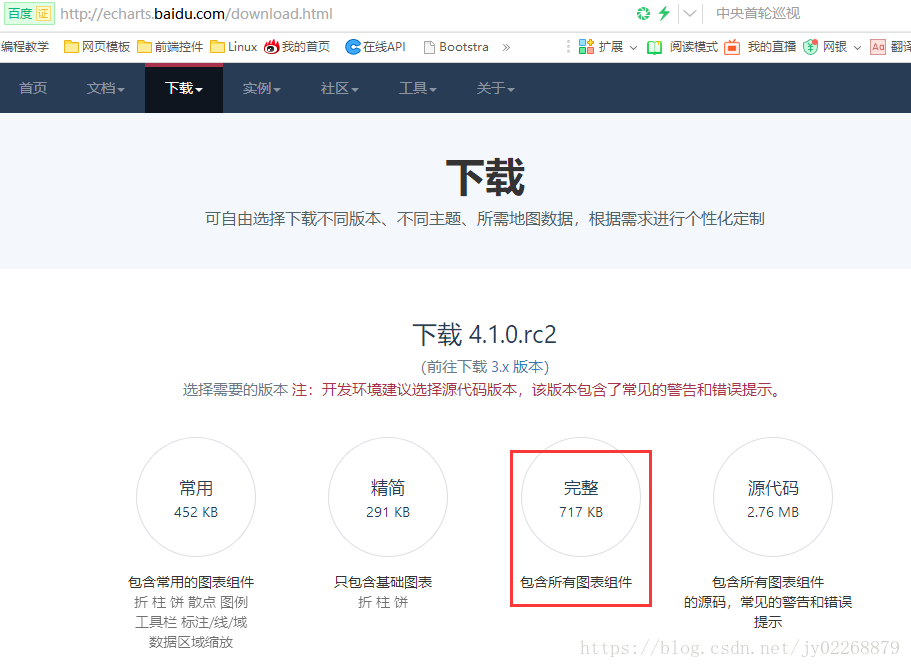
下载echarts
把echarts.min.js文件放到项目中。
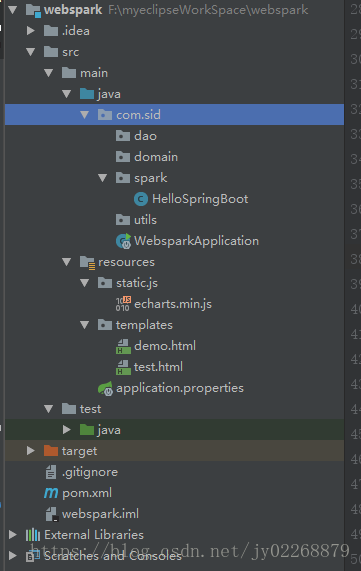
项目目录
pom.xml
<?xml version="1.0" encoding="UTF-8"?>
<project xmlns="http://maven.apache.org/POM/4.0.0" xmlns:xsi="http://www.w3.org/2001/XMLSchema-instance"
         xsi:schemaLocation="http://maven.apache.org/POM/4.0.0 http://maven.apache.org/xsd/maven-4.0.0.xsd">
    <modelVersion>4.0.0</modelVersion>

    <groupId>com.sid.spark</groupId>
    <artifactId>webspark</artifactId>
    <version>0.0.1-SNAPSHOT</version>
    <packaging>jar</packaging>

    <name>webspark</name>
    <description>Demo project for Spring Boot</description>

    <parent>
        <groupId>org.springframework.boot</groupId>
        <artifactId>spring-boot-starter-parent</artifactId>
        <version>2.0.3.RELEASE</version>
        <relativePath/> <!-- lookup parent from repository -->
    </parent>

    <properties>
        <project.build.sourceEncoding>UTF-8</project.build.sourceEncoding>
        <project.reporting.outputEncoding>UTF-8</project.reporting.outputEncoding>
        <java.version>1.8</java.version>
    </properties>

    <dependencies>
        <dependency>
            <groupId>org.springframework.boot</groupId>
            <artifactId>spring-boot-starter-web</artifactId>
        </dependency>

        <dependency>
            <groupId>org.springframework.boot</groupId>
            <artifactId>spring-boot-starter-test</artifactId>
            <scope>test</scope>
        </dependency>

        <dependency>
            <groupId>org.springframework.boot</groupId>
            <artifactId>spring-boot-starter-thymeleaf</artifactId>
        </dependency>
    </dependencies>

    <build>
        <plugins>
            <plugin>
                <groupId>org.springframework.boot</groupId>
                <artifactId>spring-boot-maven-plugin</artifactId>
            </plugin>
        </plugins>
    </build>


</project>
application.properties
配置项目访问端口9999,配置前缀/sid
server.port=9999
server.servlet.context-path=/sidHelloSpringBoot.javapackage com.sid.spark.webspark;
import org.springframework.web.bind.annotation.RequestMapping;
import org.springframework.web.bind.annotation.RequestMethod;
import org.springframework.web.bind.annotation.RestController;
import org.springframework.web.servlet.ModelAndView;
@RestController
public class HelloSpringBoot {
@RequestMapping(value="/hello",method = RequestMethod.GET)
public String sayHello(){
return "Hello Spring Boot!";
}
@RequestMapping(value="/first",method = RequestMethod.GET)
public ModelAndView firstDemo(){
return new ModelAndView("test");//跟templates文件夹下的test.html名字一样,返回这个界面
}
@RequestMapping(value="/courseClickCount",method = RequestMethod.GET)
public ModelAndView courseClickCountStat(){
return new ModelAndView("demo");//跟templates文件夹下的demo.html名字一样,返回这个界面
}
}
test.html
<!DOCTYPE html>
<html lang="en">
<head>
<meta charset="UTF-8">
<title>Title</title>
<!-- 引入 ECharts 文件 -->
<script src="js/echarts.min.js"></script>
</head>
<body>
<!-- 为 ECharts 准备一个具备大小(宽高)的 DOM -->
<div id="main" style="width: 600px;height:400px;position:absolute;top:50%;left: 50%;margin-top: -200px;margin-left: -300px;"></div>
<script type="text/javascript">
// 基于准备好的dom,初始化echarts实例
var myChart = echarts.init(document.getElementById('main'));//main是<div id="main" style="width: 600px;height:400px;"></div>的id
// 指定图表的配置项和数据
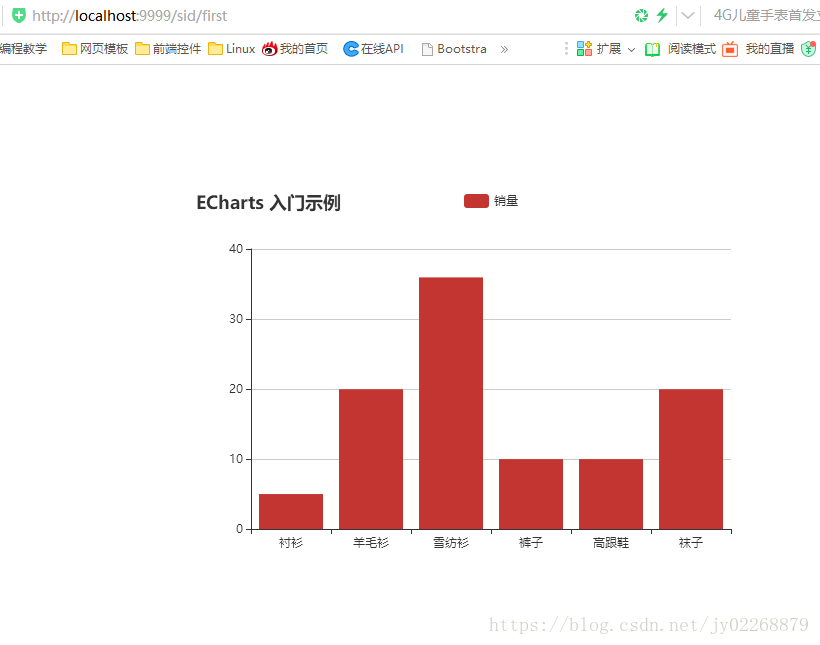
var option = {
title: {
text: 'ECharts 入门示例'
},
tooltip: {},
legend: {
data:['销量']
},
xAxis: {
data: ["衬衫","羊毛衫","雪纺衫","裤子","高跟鞋","袜子"]
},
yAxis: {},
series: [{
name: '销量',
type: 'bar',
data: [5, 20, 36, 10, 10, 20]
}]
};
// 使用刚指定的配置项和数据显示图表。
myChart.setOption(option);
</script>
</body>
</html>demo.html
<!DOCTYPE html>
<html lang="en">
<head>
<meta charset="UTF-8">
<title>Demo</title>
<!-- 引入 ECharts 文件 -->
<script src="js/echarts.min.js"></script>
</head>
<body>
<!-- 为 ECharts 准备一个具备大小(宽高)的 DOM -->
<div id="main" style="width: 600px;height:400px;position:absolute;top:50%;left: 50%;margin-top: -200px;margin-left: -300px;"></div>
<script type="text/javascript">
// 基于准备好的dom,初始化echarts实例
var myChart = echarts.init(document.getElementById('main'));//main是<div id="main" style="width: 600px;height:400px;"></div>的id
// 指定图表的配置项和数据
var option = {
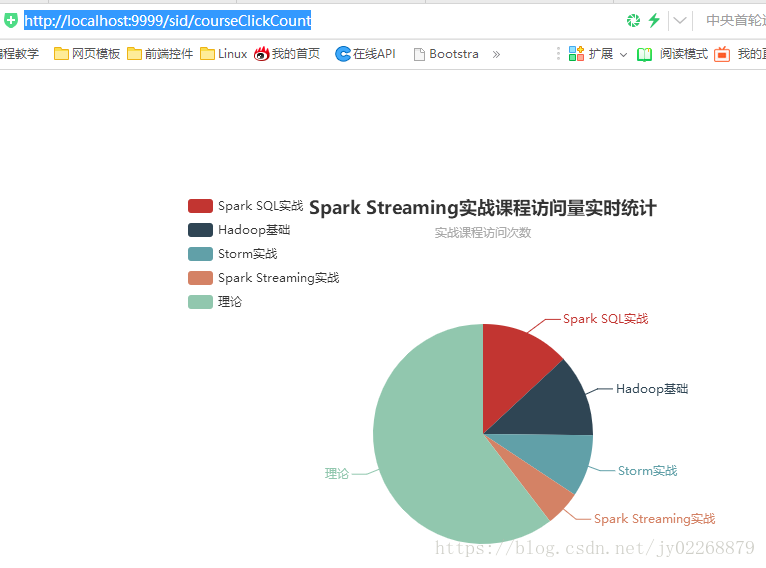
title : {
text: 'Spark Streaming实战课程访问量实时统计',
subtext: '实战课程访问次数',
x:'center'
},
tooltip : {
trigger: 'item',
formatter: "{a} <br/>{b} : {c} ({d}%)"
},
legend: {
orient: 'vertical',
left: 'left',
data: ['Spark SQL实战','Hadoop基础','Storm实战','Spark Streaming实战','理论']
},
series : [
{
name: '访问次数',
type: 'pie',
radius : '55%',
center: ['50%', '60%'],
data:[
{value:3350, name:'Spark SQL实战'},
{value:3100, name:'Hadoop基础'},
{value:2340, name:'Storm实战'},
{value:1350, name:'Spark Streaming实战'},
{value:15480, name:'理论'}
],
itemStyle: {
emphasis: {
shadowBlur: 10,
shadowOffsetX: 0,
shadowColor: 'rgba(0, 0, 0, 0.5)'
}
}
}
]
};
// 使用刚指定的配置项和数据显示图表。
myChart.setOption(option);
</script>
</body>
</html>运行项目

访问http://localhost:9999/sid/hello

http://localhost:9999/sid/first
http://localhost:9999/sid/courseClickCount


 1438
1438


 被折叠的 条评论
为什么被折叠?
被折叠的 条评论
为什么被折叠?
 到【灌水乐园】发言


