|  What are some of the most useful monitoring tools for Java developers? Monitoring is an essential function in production environments today. Errors and performance issues pop up all the time – not just during business hours – so good monitoring tools need to be active 24/7. There are a lot of tools out there that tackle this issue from different angles, so getting a sense of which ones to consider can be tough. Today, I’m taking a look at 7 monitoring tools that are on the newer side or are worth considering as an alternative or addition to tools like New Relic and AppDynamics. The tools comprise a mix of open source and SaaS models, and each of them has their own specialty or lean, be it metrics, visualizations, or error tracking.
| 译者信息 Java 开发者最有用的监控工具有哪些呢? 监测是当今生产环境中很重要的一个功能。错误和性能问题任何时间都会出现 —— 不仅仅在业务时间内 —— 所以好的监控工具需要 7 天 24 小时。目前有许多从不同角度解决这个问题的工具,所以弄清楚去采用哪个不是那么简单。 今天,我带来了 7 个监测工具以及它们的新一面,它们都是值得考虑作为像 New Relic 或 AppDynamics 的替代或补充。这些工具包括混合开源和 SaaS 模式,它们每个人都有其在度量、可视化或跟踪错误方面的专长或缺憾。 |
SaaS Tools
1. Datadog Datadog is SaaS monitoring tool targeted for DevOps teams that takes data from your app and a wide range of other tools and provides insights and visualizations. It unifies data produced from your infrastructure and software into one location, allowing you to build dashboards or search across the data you feed it. They are currently built around aggregating and presenting data rather than performing analytics of their own. One benefit of Datadog is that they offer full access to their API, which opens up the flexibility to develop your own metrics or integrations. 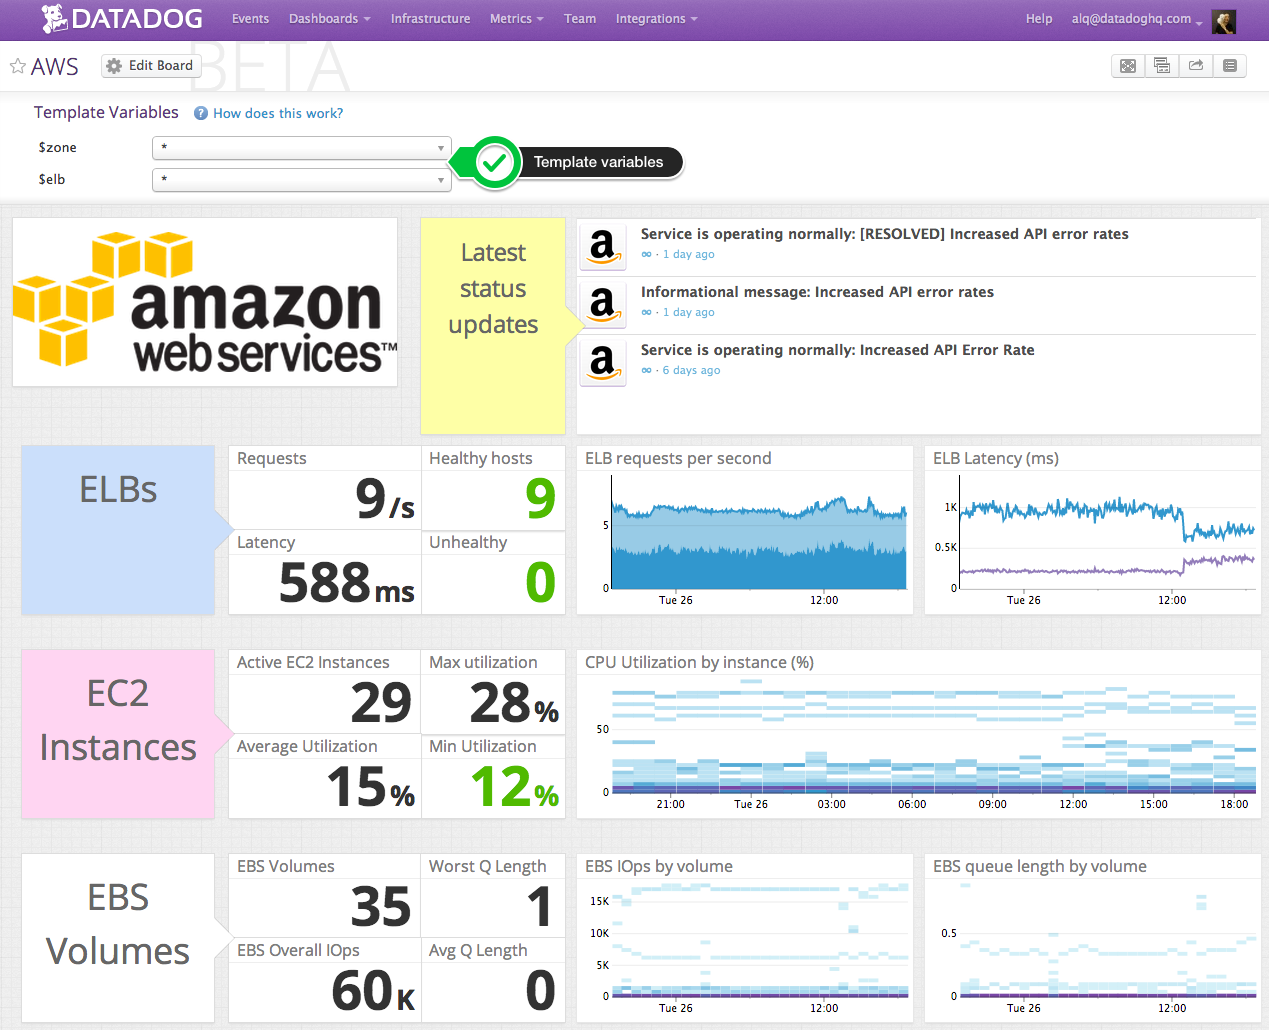
Example Datadog dashboards Downsides: Datadog doesn’t provide much in the way of their own analytics today, which can be something you may be looking for in a monitoring tool. They also require you to weave them into your code, which creates dependencies. | 译者信息 SaaS工具
1. Datadog Datadog 是 SaaS 监测工具,针对 DevOps 团队,从你的 app 或者其他各种工具获取数据并提供数据可视化功能。它把从你基础设备和软件采集的数据统一处理并存储。允许你创建仪表盘和搜索访问你提供的数据。他们目前提供数据的聚合和展示而不是提供数据分析。 Datadog 的一个优点是了开放所有 API,可以让你很灵活的开发自己的指标或整合。
Datadog 仪表盘示例 缺点: Datadog 尚未提供太多数据统计功能,做为一个监控软件,这些功能可能恰恰是你正在寻找的。他们还需要植入你的代码,这会产生代码依赖。
|
| Cost: They have a free version, as well as a Standard version with a sliding scale of $15/host/month. The scale is based on number of hosts.
The Java Angle: Officially, the Datadog API supports Python, Ruby, and C#. However, thanks to their open API access, the Datadog community has written several libraries for Java, including ones for StatsD and Codahale metrics. Takeaway: With their alerting capabilities and performance monitoring, Datadog can be used as a cheaper APM alternative. Their range of integrations helps plug them into your environment without much trouble. Datadog is a solid tool for gathering and visualizing metrics, but they aren’t an analytics tool, so look elsewhere if you want those functionalities. | 译者信息 费用:它有免费版本和15美元/台/月的标准版本,标准版费用可上下浮动,浮动的多少要看主机的数量。 java支持方面:官方文档中说明,Datadog API 支持 Python,Ruby 和 C#。不过,由于它的 API 访问是开放的,因此 Datalog 社团编写了几个 Java 方面的库,其中包括对 StatsD 和 Codahale 测量支持的库。 其他:由于 Datadog 具有告警功能,而且可监控性能,因此它可作为一个价格相对便宜的应用程序性能监控器(APM)。有许多集成方案可以让你毫不费力地把它集成到你的运行环境中。Datadog 是一个强大的采集并可视化测量结果的工具,而不是分析工具,因此如果你需要的是分析工具,那就要另寻它物了。 |
2. Ruxit
Developed by Dynatrace, Ruxit is an application performance monitoring tool that operates in a SaaS model. It was developed to provide a different APM experience through SaaS and to work in high scale environments. It installs as a single agent and doesn’t require you to configure your environment for it, which provides an ease of setup advantage over similar tools like New Relic. They monitor user activity, application performance, servers, and network activity. 
Ruxit dashboards Downsides: Ruxit doesn’t provide as much feature depth as other APM tools in the space. Cost: Ruxit costs $0.15/host/hour for application monitoring and $0.15 per 1,000 visits for Real User Monitoring. The Java Angle: Ruxit works with any Java server and Java versions 1.5+. Java was one of their first languages, so it has some of the better support. Takeaway: Ruxit is a SaaS APM tool that is easy to setup and integrate into your environment. The tool provides a good range of breadth into your environment, providing views into several different areas. | 译者信息 2. Ruxit
它由 Dynatrace 开发,Ruxit 是一个应用性能监控工具,它作用于 SaaS 模型。它通过 SaaS 提供不同的 APM 体验,并工作在高扩展性环境中。它作为一个代理安装,不需要你配置环境,它还提供了一个类似于 New Relic 的易于安装的工具。他们监控用户的活动,应用性能,服务器和网络活动。
Ruxit面板 缺点: Ruxit 没有在空间上提供很多深度功能给其他的 APM 工具。 消耗: Ruxit 监控应用会消耗 $0.15/主机/小时,并且对真实的用户监控(Real User Monitoring)来说每 1000 个访问者就花费 $0.15。 The Java Angle: Ruxit 可以工作在任何 Java 1.5 版本以上的 Java 服务器上。Java 是他们首选语言,因此能获得更好的支持。 Takeaway: Ruxit 是一个 SaaS APM 工具,并且它易于安装也易于集成到你的环境中去。工具为你的环境提供一个良好的范围广度,并提供几个不同区域的视图。
|
| Takipi tells you when and why your code breaks in production. It detects all types of errors and gives you the code and variable state when they happened. Takipi runs as a Java agent, and has no reliance on log files, which enables it to maintain <3% CPU and IO overhead. On the installation side, it does not require code changes, binary dependencies, or build configurations. With integrations like JIRA and Slack, Takipi is simple to slide into your existing workflow. 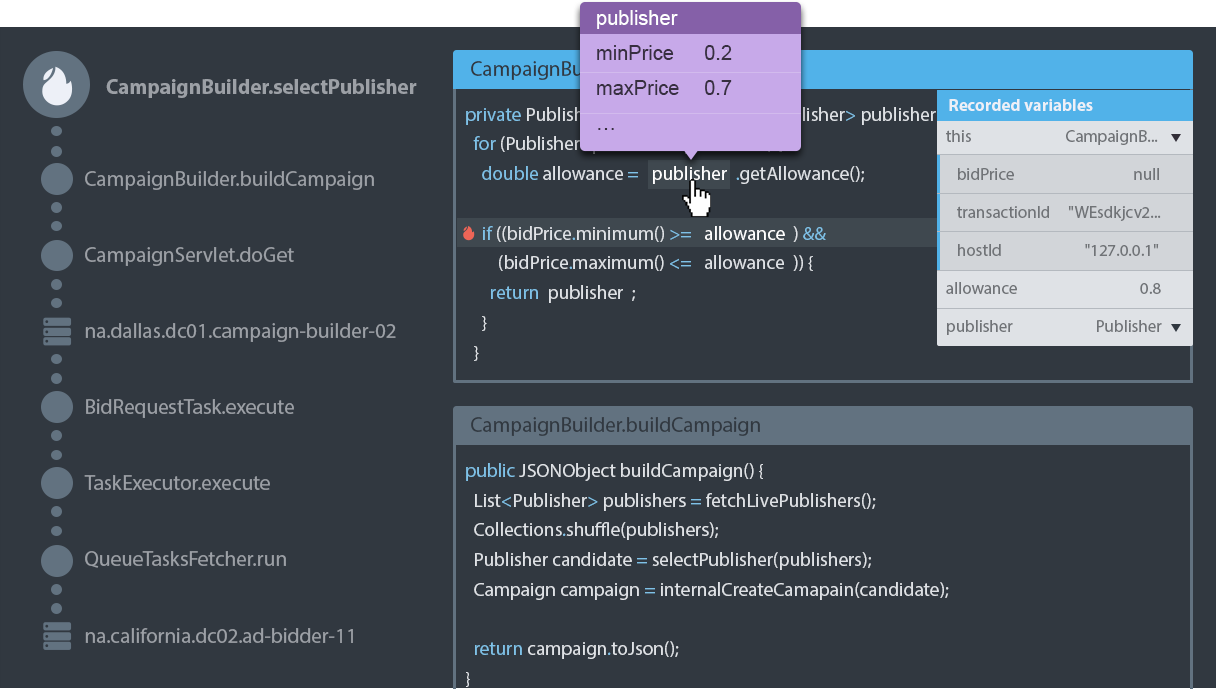
An error analysis view in Takipi Downsides: It’s a JVM-level tool exclusively, so non-JVM languages are not supported. Today, it does not have APIs to integrate with other alerting tools. Cost: Free tier, sliding scale pro tier of $69/server/month, and enterprise tier. Tiers are based on data retention, error analyses numbers, and deployment options. The Java Angle: Takipi is a JVM-level tool. It works for any JVM-based language without requiring workarounds. Takeaway: Unlike other tools which stop at the stack trace level, Takipi gets down to the JVM level to bring you the actual code and variable state you need to solve each error. With Takipi, you can tell if a new deployment broke something in your code, get insight into all the errors happening in your application, and zoom in on critical issues. | 译者信息 Takipi 告知你生产环境下的代码在什么时候、因什么原因而终止执行。它对所有错误进行检测,同时会给出出现错误时代码的位置和变量的状态。Takipi 是以 Java 代理的身份运行的,与任何日志文件无关,这样就会减少小于 %3 的 CPU 和 IO 运行花费。安装 Takipi 的时候,也不需要进行代码更改,不需要安装二进制依赖包或者进行构建配置的设置。就像集成 JIRA 和 Slack 那样,Takipi 可以非常简单地插入到工作流程中。
Takipi 的错误分析界面 缺点:它是一个只可用在 JVM 层上的工具,因此 JVM 不支持的语言它也不支持。目前,它也没有可以与其他告警工具集成在一起的 API。 费用:免费级;专业级,其费用可上下浮动,69美元/服务器/月;企业级。级别的划分是根据保存的数据量,分析的错误数和部署选项而确定的。 Java支持方面:Takipi 是运行在 JVM 层上的工具。任何不需要其它环境就可以运行在 JVM 上的语言,它都支持。 其他:与其他停留在栈追踪层级的工具不同,Takipi 深入到 JVM 层级上,可以按照你的要求向你展示实际运行的代码和变量的状态,以达到对每个错误的解析。通过 Takipi,你可以确定是否是新部署终止了正在运行的代码, 通过深入地分析应用出现的所有错误,聚焦出问题的关键所在。 |
4. Rollbar
Rollbar focuses on error tracking and monitoring. They use stack tracing to capture errors in your application. The upside of this is that it can work with a wide range of languages and environments. Rollbar offers the ability to go in and report exceptions and events manually as well. Beyond tracking uncaught exceptions, they also provide some alerting and analysis capabilities. 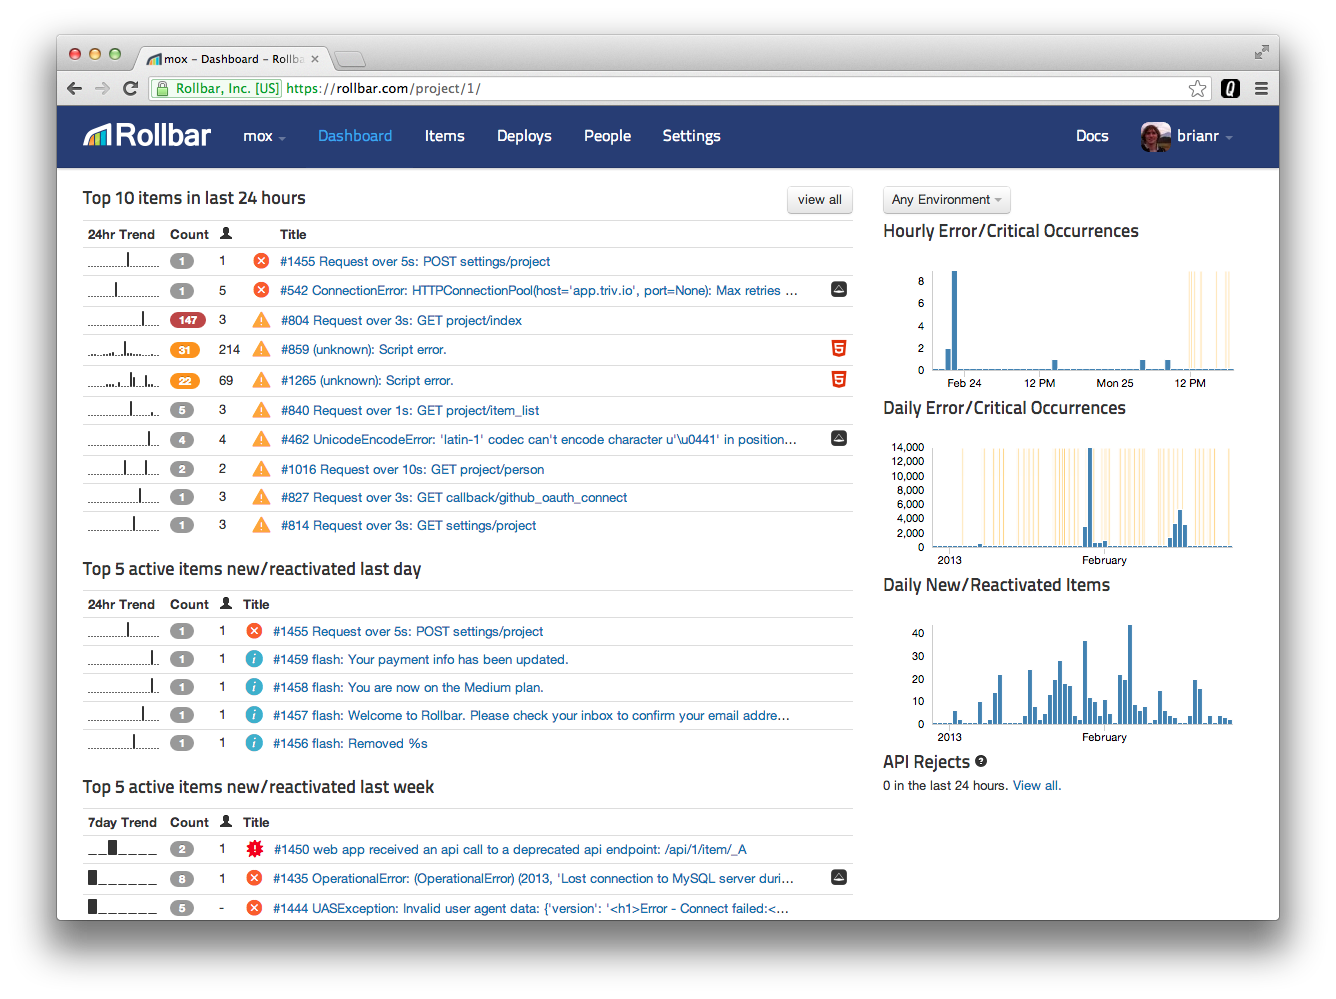
Rollbar Dashboard Downsides: Rollbar can only capture uncaught exceptions. If you want to capture caught exceptions or anything else, you have to do so by hand. By relying on top-level uncaught exception handlers, it can miss exceptions that are swallowed up by your framework to prevent thread death. Cost: Free version, $29/month, $99/month and $249/month versions based on number of events tracked and length of data retention.
The Java Angle: Rollbar does not have official libraries for Java, but their community has written a few that can send your logs to Rollbar. Takeaway: Rollbar is a stack trace-based error tracking application that can play well with most languages. The tradeoff for that is that they can only capture uncaught exceptions and events you manually send them. | 译者信息
4. Rollbar Rollbar 着眼于错误追踪与监控。它使用堆栈追踪来捕捉应用中出现的错误。这样做的好处是可以支持更多的语言和环境。Rollbar 也提供手工方式深入异常、事件内部,并提供报告的能力。除提供强大的异常捕获能力外,还提供了一些警报和分析能力。
Rollbar 仪表板 劣势: Rollbar 仅能捕获“程序未捕捉异常”。如果你打算捕获程序捕捉异常或其他,只好手工来做。由于依赖顶层程序未捕捉异常处理器,它能忽略由框架产生的异常,避免线程死锁。 成本: 免费版本, $29/每月, $99/月 and $249/月,区别在与追踪到的事件数量及数据保留长度.
Java支持: Rollbar 没有提供 Java 的官方支持库,但社区提供了一些实现,可以讲你的日志发给 Rollbar.
概述: Rollbar 是基于堆栈的错误追踪应用,它能兼容大多数开发语言。但负面影响是它仅能捕获程序未捕捉异常及手动发送的事件。 |
Open Source
5. Sensu Sensu is an open source monitoring framework for application and system services. It can collect and ship metrics to a variety of tools and provide alerts for defined events. Written in Ruby, Sensu uses a “checks and handlers” setup, wherein periodic check scripts are run to look for pre-defined conditions, which are then reported to handlers if present. Handlers are used to send notifications or take other actions. 
Alerts in Sensu Downsides: Sensu isn’t as broadly reaching as true APM tools like Ruxit. It’s focus is on server monitoring. On the installation front, Sensu has dependencies on RabbitMQ and Redis, as well as several other dependencies wrapped in their required repositories. There are some concerns around scaling capabilities and maintenance complications, but your mileage may vary. Cost: Sensu Core (their open source project) is free, but they also offer Sensu Enterprise, which adds additional integrations, support, and features. Sensu Enterprise costs $2/server/month, with volume discounts at high scale. The Java Angle: Sensu check and handler scripts can be written in any language, and the Sensu community has written some plugins for Java. Takeaway: Sensu is an open source framework alternative for cloud and server monitoring. There are some questions around high scale and complexity, but it’s a strong tool for metrics gathering and service monitoring. | 译者信息 开放源代码(的监控工具) 5. Sensu Sensu 是一个面向应用和系统服务的开源监控框架。它能收集和使用多种工具的度量值,并提供已定义事件报警。Sensu,使用 Ruby 实现,采用“检查和处理器”设定,周期性运行检查脚本,查找预定义条件,如果条件满足,则向处理器报告。处理器用于发送通告或采取其他处置方法。
Sensu中的警报 劣势: 不像 Ruxit,Sensu 并没有真正的实现 APM 工具。它着重于服务器监控。在安装前端, Sensu 依赖 RabbitMQ 和 Redis,及其他依赖,这些依赖包可以在指定的软件仓库中找到。还有一些对于可扩展能力和维护复杂性的担忧。当然,你的需求可能不同。 成本: Sensu Core 核心版(其中的开源项目)免费, 但也提供企业版本,企业版提供附加的集成、支持和特性。企业版费用标准: $2/每服务器/每月, 大规模部署享受折扣. Java视角: Sensu 的检查和处理器脚本能用任何开发语言编写, Sensu 社区提供了Java支持插件。 概述: Sensu 是云和服务器监控的一个开源替代框架实现,在搞扩展性和复杂性上还存在一些问题,但它仍然不失为一个度量参数值收集和服务监控的强力工具。 |
6. ELK stack
The ELK Stack isn’t exactly new, but we’d be remiss to make this list and leave it off. Made up of ElasticSearch, Logstash, and Kibana, the ELK stack is a popular set of open source tools for monitoring, logging, and visualizing your data. Elasticsearch handles the search and analytics, Logstash is the log aggregator, and Kibana does the fancy dashboard visualizations. We’ve been using it at Takipi for a while, feeding it from Java through our logs and Redis, and it’s in use both by developers and for BI. Today, Elasticsearch is pretty much built-in with Logstash, and Kibana is an Elastic product as well, making integration and setup very simple. You can mix and match the three tools if you’d like as well. When a new deployment rolls out, the dashboards follow custom indicators that you can set up about your app’s health. These indicators update in real time, allowing close monitoring when freshly delivered code takes its first steps after being uploaded to production. 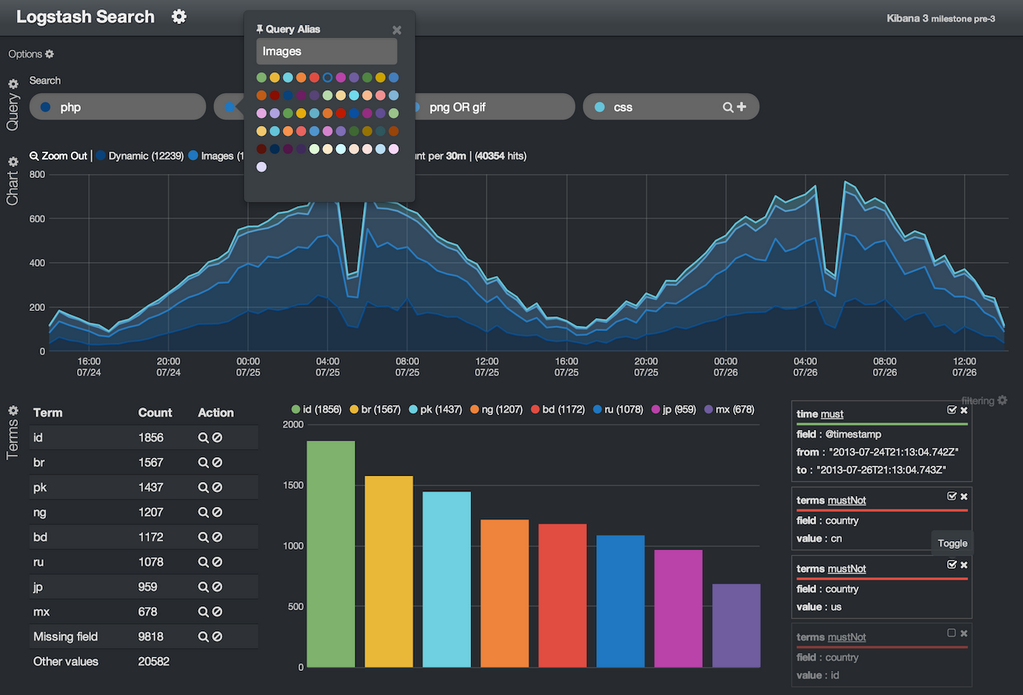
An ELK Stack view | 译者信息 6. ELK stack
ELK Stack,严格来讲,不是一个新产品,但我们常常忽略掉它,不放到我们的讨论列表中。 ELK stack 是一个流行的工具套件,功能涵盖监控、日志和数据可视化。它由 ElasticSearch, Logstash, and Kibana 三部分组成。其中,Elasticsearch 负责搜索和分析,Logstash 是日志聚积器,而 Kibana则提供华丽的可视化仪表盘。我们已经在 Takipi中 使用 ELK Stack一段时间,使用 java 通过日志和Redis 提供输入。这既适用于开发者,同样可用于 BI。今天, Elasticsearch 完美内置了 Logstash, Kibana 也是灵活的独立工具。它们集成和设置都很简单。你可以按照你的需要灵活搭配这三个工具使用。当实施(推出)新的部署时,仪表盘会遵照你设定的应用健康参数阀值指示器工作。这些指示器会实时更新,同样允许你在上传产品补丁代码时,暂时关闭监控。
ELK Stack 视图
|
| Downsides: The ELK Stack faces the standard downsides for open source tools (namely that setup costs and deployment issues are yours to shoulder). At higher scale, the number of machines needed to run ELK Stack starts to multiply aggressively, which creates a need to upkeep and monitor them yourself. One possible solution is using hosted services like Logz.io to help manage this pressure.
Cost: As open source tools, the ELK Stack doesn’t have a price barrier, although there are professional support and services available from Elastic. The Java Angle: The ELK Stack is designed for Java. In fact, a Java runtime is required to run ElasticSearch and Logstash. Elastic recommend having at least Java 7, and all ElasticSearch nodes should run on the same JVM version. Takeaway: ELK stack, the name for ElasticSearch, Logstash, and Kibana, is a set of open source tools that delivers search & analytics, logging, and visualization capabilities. The tools are built to integrate well together, so using the full set is simple (although not required). | 译者信息 劣势:ELK Stack 有着开源工具所通用的缺点(即你需要自己承担工具的安装成本和部署问题)。在大规模数据情况下,需要运行 ELK Stack 的机器数量成倍增长,这就需要你自己来监控和维护这些额外的机器。一种可行的方案是使用托管服务,例如 Logz.io 来减轻这种监控的压力。 成本: 作为开源工具,ELK Stack 没有任何价格负担,但它也可以提供来自 Elastic 专业的服务支持。 Java视角: ELK Stack 转为 Java 设计。事实上,ElasticSearch 和 Logstash 运行在 Java 环境。Elastic 要求的 Java 版本最低为 Java7,且所有的 ElasticSearch 节点的 JVM 版本必须相同。
其他: ELK Stack,包括 ElasticSearch Logstash, 和 Kibana,是一整套提供搜索分析日志并带有可视化功能的开源工具。这一套工具整合地非常好,所以使用起来也很简单(虽然它并不是必须的)。
|
7. Graphite
Graphite is a visualization tool for monitoring metrics in your application. Made up of three components (Carbon, Whisper, and Graphite-web), its open source nature makes it easy to customize and tinker with. We wrote about building your own Graphite architecturehere. Graphite has a powerful querying API and a fairly feature-rich setup. It doesn’t capture its own metrics, but the Graphite metric protocol is often chosen the de facto format for many metrics gatherers, so feeding it data is rarely a problem. Using Graphite enables you to create an extensive range of views into your application. 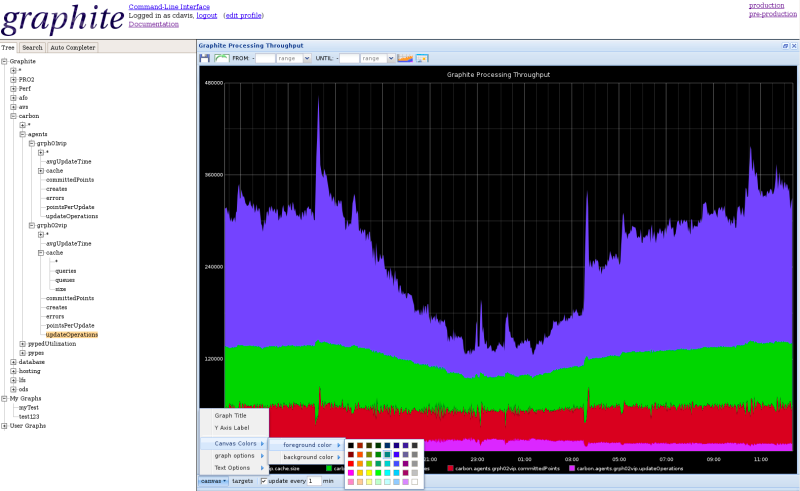
The default Graphite dashboard GUI
| 译者信息 7. Graphite
Graphite 是应用程序监控度量值的可视化工具,包括三个组件 (Carbon, Whisper, 和Graphite-web),它的开源特性使得它能被方便定制和改进. 如何构建你自己的 Graphite 构架,可以参看我们的文章 here。 Graphite 提供了强大的查询访问API和特性丰富的设置。它并不需要设置自身的度量,而是提供Graphite metric protocol ,被多种度量采集器选择的事实协议格式。因此,输入给它的数据完全不是问题。使用 Graphite 能使你为你的应用创建各种视图。
默认的Graphite仪表盘GUI |


 4万+
4万+

 被折叠的 条评论
为什么被折叠?
被折叠的 条评论
为什么被折叠?
 到【灌水乐园】发言


