


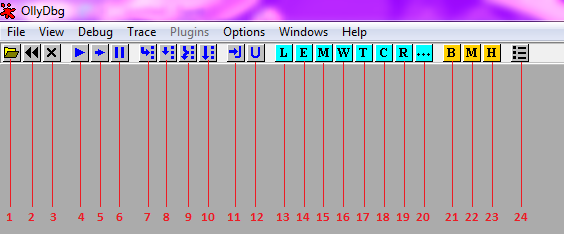
1. This is the Open button. As you’ve probably already guessed, it opens a file into Olly.
2. This is the Restart button. Fairly obvious, it restarts our executable.
3. This is the Close button. It closes down the executable we’re working with so we can load a new one.
4. This is the Run button. It starts our executable, so we can begin stepping through/analyzing it.
5. This is the Run Thread button. It does the same as above, but only runs the current thread.
6. This is the Pause button. It pauses out executable so we can look around or do other things.
7. This is the Step Into button. It steps down into the next line, or enters the current function.
8. This is the Step Over button. It does the same as above, but executes the function all at once, instead of going into it and stepping through each action.
9. This is the Trace Into button. Same premise as the Step Into button, but works with our run trace.
10. This is the Trace Over button. Same premise as the Step Over button, but works with our run trace.
11. This is the Execute Until Return button. It will keep stepping into the application until it hits a return, either from a function, or the application itself.
12. This is the Execute Until User Code button. It will keep stepping into the application until it hits code that is not part of the system functions.
(The following are windows.)
13. This is the Logger window. Pretty self-explanatory.
14. This is the Executable Modules window. This is very useful for switching to which portion of the application and/or its extensions/libraries you want to look through.
15. This is the Memory Map window. We can use this to find something specific in the memory space of the application. This is a good way to find the un-packed data inside a packed application.
16. This is the Window List . It usually shows us a list of window handles owned by our application. Also very useful.
17. This is the Threads window. This allows us to see and select which thread we want to work with, amongst other things.
18. This is the CPU window. This is where the core of the application is shown: the code. This is usually shown in Assembly code, and this is where we will do most of our work. In this window we can do anything from monitor the actions the application takes, to changing what the application will do next in real-time.
19. This is the Search Results window. Pretty self-explanatory.
20. This is the Run Trace window. This will be more useful later on, and is very helpful for tracing changed in certain things.
21. This is the Breakpoints window. This gives us a list of the breakpoints we currently have set, so we can just double click then to jump straight to that location in the memory. Very useful .
22. This is the Memory Breakpoints window. Pretty self-explanatory.
23. This is the Hardware Breakpoints window. Pretty self-explanatory.
24. This is the Options window. We can change lots of things related to Olly in here, including colors.


 6093
6093

 被折叠的 条评论
为什么被折叠?
被折叠的 条评论
为什么被折叠?
 到【灌水乐园】发言


