


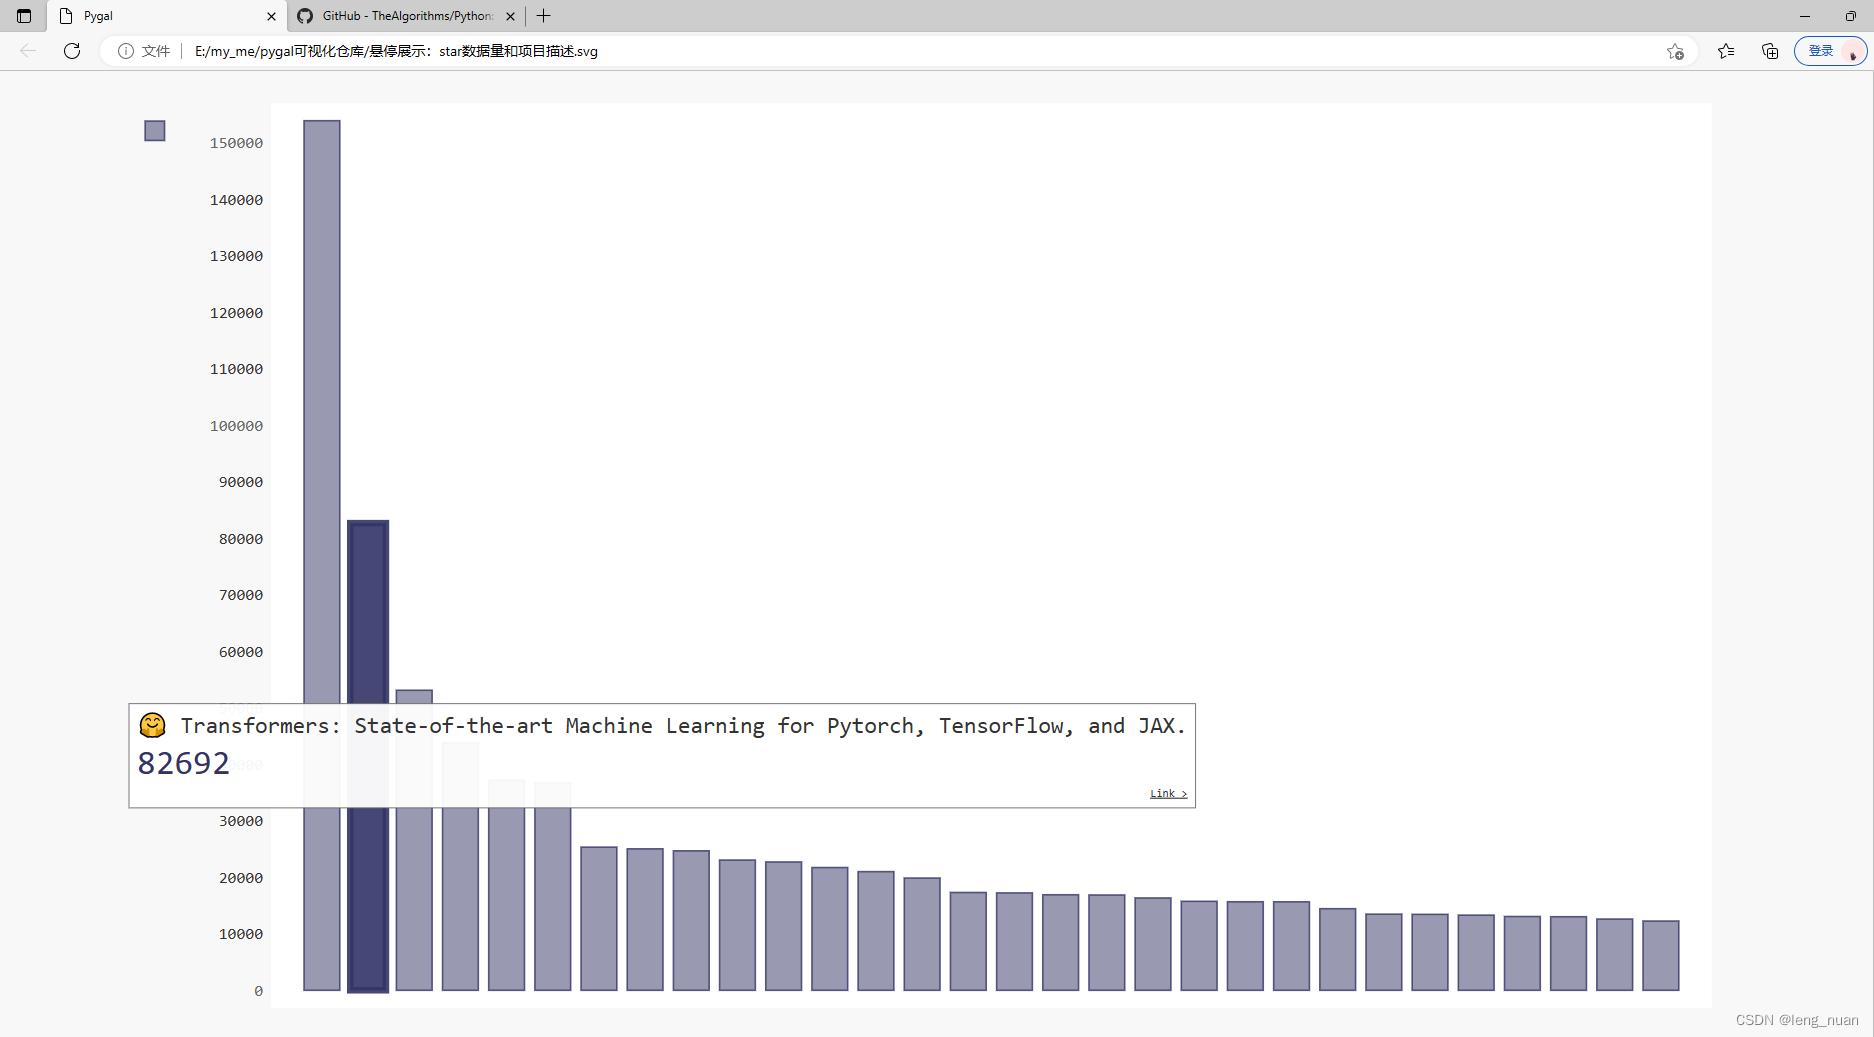
 该代码示例展示了如何利用Python的pygal库构建一个条形图,其中条形的高度表示GitHub项目获得的星标数。当用户点击条形时,会跳转到该项目在GitHub的主页。程序通过GitHubAPI获取Python语言的项目信息,包括项目名称、星标数和描述,并在图表上为每个条形添加了工具提示显示项目描述。
构建条形图:条形高度表示项目获得了多少星;点击条形将进入GitHub主页;
依赖:
    pip install pygal
import requests
import pygal
from pygal.style import LightColorizedStyle as LCS, LightenStyle as LS

class AddTool:
    '''添加工具提示:
    鼠标指向条形框后,显示表示信息,已有了显示项目的start数,下面添加显示项目的描述
    '''

    # 执行API调用并存储响应
    URL = 'https://api.github.com/search/repositories?q=language:python&sort=start'
    r = requests.get(URL)
    print("Status code:", r.status_code)
    # 将API响应存储在一个变量
    requests_dict = r.json()  #类
    print("total repositories:", requests_dict['total_count'])
    # 研究有关仓库的信息
    repo_dicts = requests_dict['items']

    def chaungjiantishitool(self):
        repo_dicts=AddTool.requests_dict["items"]   #response_dict
        print("Number of items:",len(repo_dicts))
        names,plot_dicts=[],[]
        for i in repo_dicts:
            names.append(i["name"])
            i={
                'value':i['stargazers_count'],  #star数量
                'label':i['description'],    #项目描述
                'xlink':i['html_url'],  #条形图中每个条形用作网站的连接,点击即打开新的标签页并展示对应url
            }
            plot_dicts.append(i)
        #可视化
        my_style=LS("#333366",base_style=LCS)
        my_config = pygal.Config()
        my_config.x_label_rotation = 45
        my_config.title_font_size = 24
        my_config.label_font_size = 14
        my_config.major_label_font_size = 18
        my_config.truncate_label = 15
        my_config.show_y_guides = False
        my_config.width = 1000
        chart = pygal.Bar(my_config, style=my_style)
        chart.add("", plot_dicts)  # 添加数据,并将标签设置为空字符串;如果多个函数chart.add同一个文件,条形图会叠加
        chart.render_to_file("悬停展示:star数据量和项目描述.svg")


if __name__ == '__main__':
    AddTool().chaungjiantishitool()  #创建提示工具,即项目描述,单击条形,跳转网页
双击:
![]()
结果图如下:
import requests
import pygal
from pygal.style import LightColorizedStyle as LCS, LightenStyle as LS
def gongjutishi(self):
my_style = LS("#333366", base_style=LCS)
'''表格添加样式
'''
my_config = pygal.Config()
my_config.x_label_rotation = 45
my_config.title_font_size = 24
my_config.label_font_size = 14
my_config.major_label_font_size = 18
my_config.truncate_label = 15
my_config.show_y_guides = False
my_config.width = 1000
chart = pygal.Bar(my_config, style=my_style)
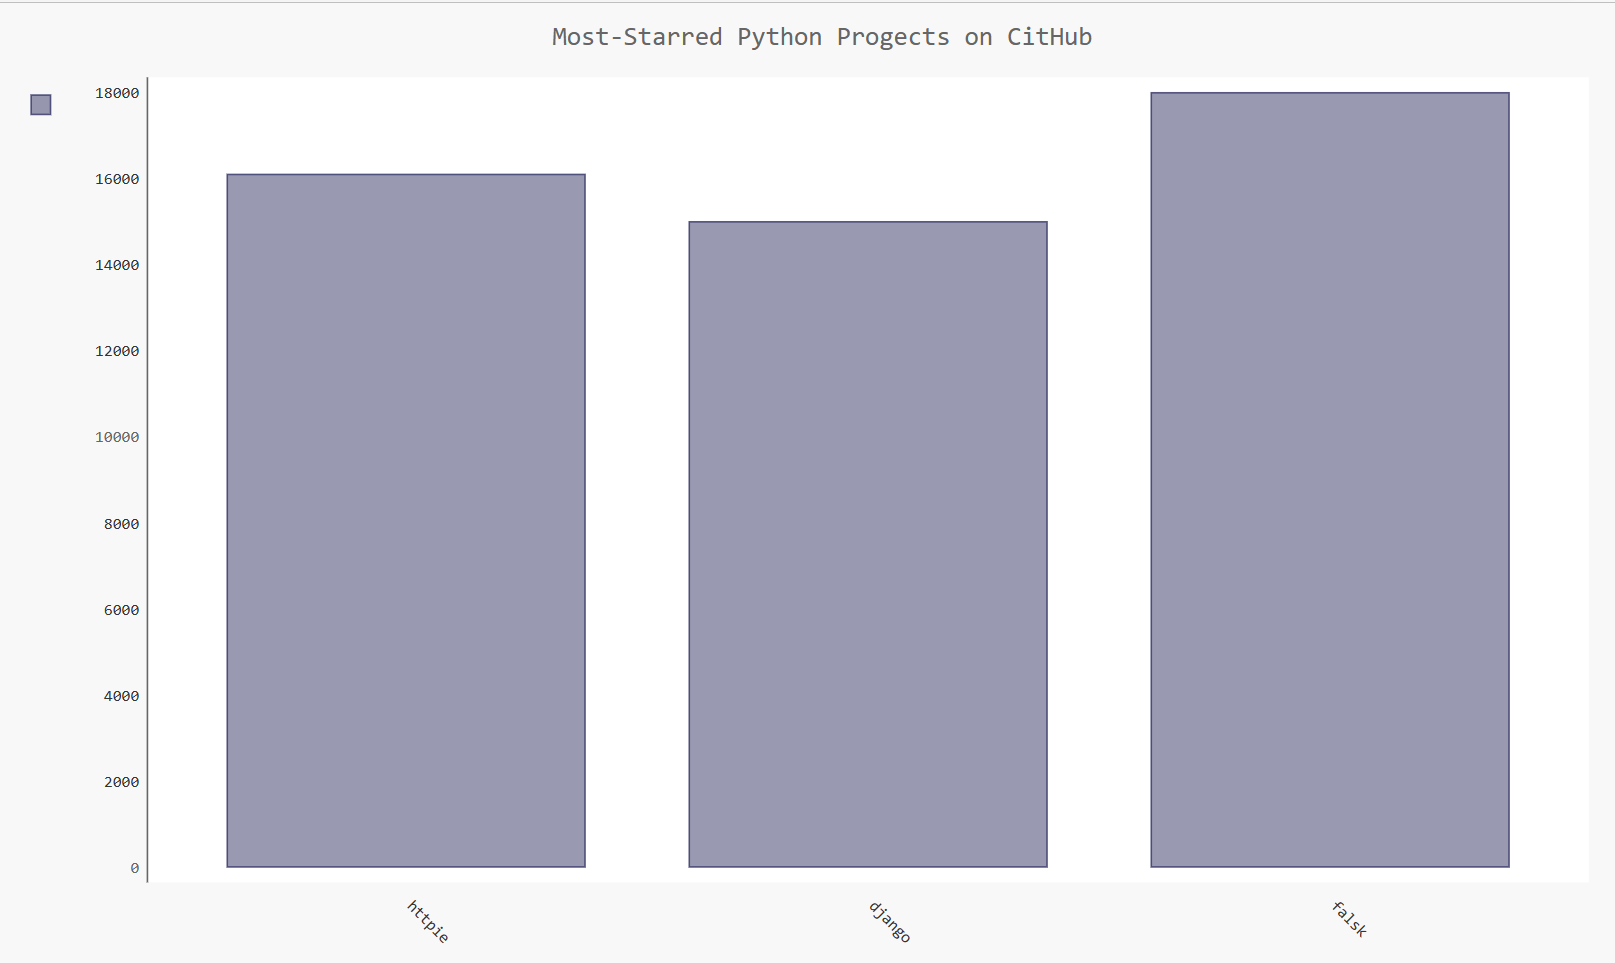
chart.title = 'Most-Starred Python Progects on CitHub'
chart.x_labels = ['httpie','django','falsk']
#创建一个字典,通过每个字典中label键值创建工具提示;
plot_dict=[
{"value":16101,"label":"Description of httpie."},
{"value": 15000, "label": "Description of django."},
{"value": 18000, "label": "Description of flask."}
]
chart.add('',plot_dict)
chart.render_to_file('添加工具提示.svg')
print('已完成添加工具提示')


 1865
1865

 被折叠的 条评论
为什么被折叠?
被折叠的 条评论
为什么被折叠?
 到【灌水乐园】发言


