


性能监控工具
在使用Linux过程中,比较头疼的就是系统提供了很多Linux系统监控工具,如何充分合理的使用这些工具,找出系统运行的性能瓶颈,包括CPU,内存,磁盘,网络瓶颈。类似的网上有很多管理员不得不学的20个基本工具。这里就不一一 介绍。这里额外补充几个使用且所见即所得的监控工具,帮助大家能更快的发现问题所在。
系统资源细分
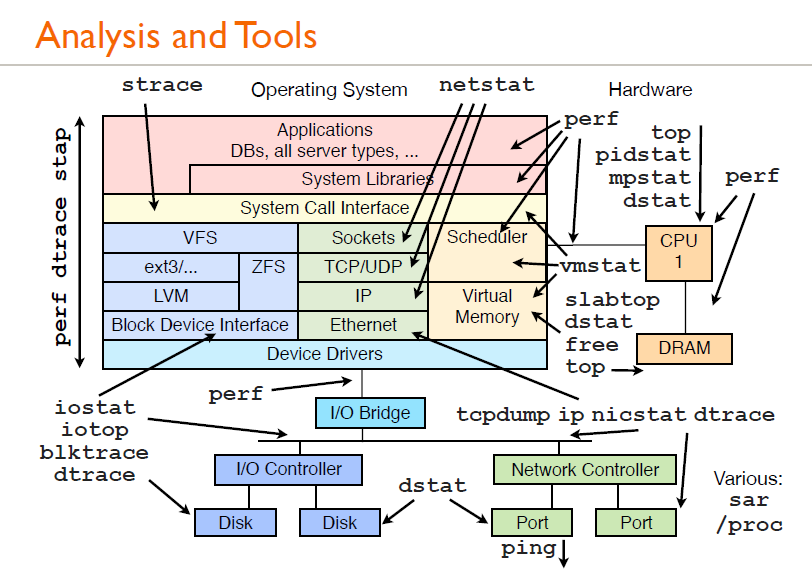
谈到系统性能监控和分析工具,就不得不提Brendan Gregg的系统分析,他的图非常系统化的展示了应用程序,系统调用,内核,协议栈,硬件等各块之间的交互。有兴趣的朋友可以根据这张图里的命令进行组合进行系统问题的监控,分析,定位。
监控工具:tsar
简介
tsar是淘宝自己开发的一个采集工具,主要用来收集服务器的系统信息(如cpu,io,mem,tcp等),以及应用数据(如squid haproxy nginx等)。收集到的数据存储在磁盘上,可以随时查询历史信息,输出方式灵活多样,另外支持将数据存储到MySQL中,也可以将数据发送到nagios报警服务器。tsar在展示数据时,可以指定模块,并且可以对多条信息的数据进行merge输出,带–live参数可以输出秒级的实时信息。
总体架构
Tsar是基于模块化设计的程序,程序有两部分组成:框架和模块。
框架程序源代码主要在src目录,而模块源代码主要在modules目录中。
框架提供对配置文件的解析,模块的加载,命令行参数的解析,应用模块的接口对模块原始数据的解析与输出。 模块提供接口给框架调用。
tsar依赖与cron每分钟执行采集数据,因此它需要系统安装并启用crond,安装后,tsar每分钟会执行tsar –cron来定时采集信息,并且记录到原始日志文件。
tsar 环境安装指南:
- 1
- 2
- 3
- 4
- 5
- 1
- 2
- 3
- 4
- 5
tsar配置介绍
前面介绍了tsar的介绍,现在大家来看看tsar的配置。
定时任务配置:/etc/cron.d/tsar
- 1
- 2
- 3
- 4
- 1
- 2
- 3
- 4
如上所示,/etc/cron.d/tsar里面负责每分钟以root用户的角色调用tsar命令来执行数据采集。
日志文件轮转 : /etc/logrotate.d/tsar
- 1
- 2
- 3
- 4
- 5
- 6
- 7
- 8
- 9
- 10
- 11
- 12
- 13
- 14
- 15
- 16
- 1
- 2
- 3
- 4
- 5
- 6
- 7
- 8
- 9
- 10
- 11
- 12
- 13
- 14
- 15
- 16
在日志文件轮转配置中,每个月会把tsar的本地存储进行轮转,此外这里也设定了数据在/var/log/tsar.data下
配置文件:/etc/tsar/tsar.conf
- 1
- 2
- 3
- 4
- 5
- 6
- 7
- 8
- 9
- 10
- 11
- 12
- 13
- 14
- 15
- 16
- 17
- 18
- 19
- 20
- 21
- 22
- 23
- 24
- 25
- 26
- 27
- 28
- 29
- 30
- 31
- 32
- 33
- 34
- 35
- 36
- 37
- 38
- 39
- 1
- 2
- 3
- 4
- 5
- 6
- 7
- 8
- 9
- 10
- 11
- 12
- 13
- 14
- 15
- 16
- 17
- 18
- 19
- 20
- 21
- 22
- 23
- 24
- 25
- 26
- 27
- 28
- 29
- 30
- 31
- 32
- 33
- 34
- 35
- 36
- 37
- 38
- 39
/etc/tsar/tsar.conf负责tsar的采集模块和输出的具体配置;在这里配置启用哪些模块,输出等内容。
tsar 模块库
- 1
- 2
- 3
- 4
- 5
- 6
- 7
- 8
- 9
- 10
- 11
- 12
- 13
- 14
- 15
- 16
- 17
- 18
- 19
- 1
- 2
- 3
- 4
- 5
- 6
- 7
- 8
- 9
- 10
- 11
- 12
- 13
- 14
- 15
- 16
- 17
- 18
- 19
模块路径:/usr/local/tsar/modules,各个模块的动态库so文件;
tsar使用介绍
在tsar的使用中,可以参考下面的帮助信息,完成对应的监控。
- 1
- 2
- 3
- 4
- 5
- 6
- 7
- 8
- 9
- 10
- 11
- 12
- 13
- 14
- 15
- 16
- 17
- 18
- 19
- 20
- 21
- 22
- 23
- 24
- 25
- 26
- 27
- 28
- 1
- 2
- 3
- 4
- 5
- 6
- 7
- 8
- 9
- 10
- 11
- 12
- 13
- 14
- 15
- 16
- 17
- 18
- 19
- 20
- 21
- 22
- 23
- 24
- 25
- 26
- 27
- 28
tsar cpu监控:
如下所示,使用参数–cpu可以监控系统的cpu,参数user表示用户空间cpu, sys内核空间cpu使用情况,wait是IO对应的cpu使用情况,hirq,sirq分别是硬件中断,软件中断的使用情况,util是系统使用cpu的总计情况。下表的数据可以看出,当前系统已使用大约30%的cpu。
- 1
- 2
- 3
- 4
- 5
- 6
- 7
- 8
- 1
- 2
- 3
- 4
- 5
- 6
- 7
- 8
tsar监控虚存和load情况
下图列出了对应的系统swap使用,load的使用情况。
- 1
- 2
- 3
- 4
- 5
- 6
- 7
- 8
- 9
- 10
- 1
- 2
- 3
- 4
- 5
- 6
- 7
- 8
- 9
- 10
tsar 内存使用情况
下图列出了系统内存的使用情况
- 1
- 2
- 3
- 4
- 5
- 6
- 7
- 8
- 9
- 1
- 2
- 3
- 4
- 5
- 6
- 7
- 8
- 9
tsar io使用情况
下图列出了使用tsar来监控系统IO情况
- 1
- 2
- 3
- 4
- 5
- 6
- 7
- 8
- 1
- 2
- 3
- 4
- 5
- 6
- 7
- 8
tsar 网络监控统计
- 1
- 2
- 3
- 4
- 5
- 6
- 7
- 8
- 9
- 1
- 2
- 3
- 4
- 5
- 6
- 7
- 8
- 9
- 1
- 2
- 3
- 4
- 5
- 6
- 7
- 8
- 1
- 2
- 3
- 4
- 5
- 6
- 7
- 8
tsar 检查告警信息
查看最后一次tsar的提醒信息,这里包括了系统的cpu,io的告警情况。
- 1
- 2
- 1
- 2
tsar 历史数据回溯
通过参数-d 2 可以查出两天前到现在的数据,-i 1 表示以每次1分钟作为采集显示。
- 1
- 2
- 3
- 4
- 5
- 6
- 7
- 8
- 9
- 10
- 11

- 1
- 2
- 3
- 4
- 5
- 6
- 7
- 8
- 9
- 10
- 11
参考链接:
tsar 的使用说明
系统模块
cpu
字段含义
- user: 表示CPU执行用户进程的时间,通常期望用户空间CPU越高越好.
- sys: 表示CPU在内核运行时间,系统CPU占用率高,表明系统某部分存在瓶颈.通常值越低越好.
- wait: CPU在等待I/O操作完成所花费的时间.系统部应该花费大量时间来等待I/O操作,否则就说明I/O存在瓶颈.
- hirq: 系统处理硬中断所花费的时间百分比
- sirq: 系统处理软中断所花费的时间百分比
- util: CPU总使用的时间百分比
- nice: 系统调整进程优先级所花费的时间百分比
- steal: 被强制等待(involuntary wait)虚拟CPU的时间,此时hypervisor在为另一个虚拟处理器服务
- ncpu: CPU的总个数
采集方式
CPU的占用率计算,都是根据/proc/stat计数器文件而来,stat文件的内容基本格式是:
cpu  67793686 1353560 66172807 4167536491 2705057 0 195975 609768
cpu0 10529517 944309 11652564 835725059 2150687 0 74605 196726
cpu1 14380773 127146 13908869 832565666 150815 0 31780 108418
cpu是总的信息,cpu0,cpu1等是各个具体cpu的信息,共有8个值,单位是ticks,分别是
User time, 67793686 Nice time, 1353560 System time, 66172807 Idle time, 4167536491 Waiting time, 2705057 Hard Irq time, 0 SoftIRQ time, 195975 Steal time, 609768
CPU总时间=user+system+nice+idle+iowait+irq+softirq+Stl
各个状态的占用=状态的cpu时间%CPU总时间*100%
比较特殊的是CPU总使用率的计算(util),目前的算法是:
util = 1 - idle - iowait - steal
mem
字段含义
- free: 空闲的物理内存的大小
- used: 已经使用的内存大小
- buff: buff使用的内存大小,buffer is something that has yet to be "written" to disk.
- cach: 操作系统会把经常访问的东西放在cache中加快执行速度,A cache is something that has been "read" from the disk and stored for later use
- total: 系统总的内存大小
- util: 内存使用率
采集方法
内存的计数器在/proc/meminfo,里面有一些关键项
    MemTotal:      7680000 kB
    MemFree:        815652 kB
    Buffers:       1004824 kB
    Cached:        4922556 kB
含义就不解释了,主要介绍一下内存使用率的计算算法:
util = (total - free - buff - cache) / total * 100%
load
字段含义
- load1: 一分钟的系统平均负载
- load5: 五分钟的系统平均负载
- load15:十五分钟的系统平均负载
- runq: 在采样时刻,运行队列的任务的数目,与/proc/stat的procs_running表示相同意思
- plit: 在采样时刻,系统中活跃的任务的个数(不包括运行已经结束的任务)
采集方法
/proc/loadavg文件中保存的有负载相关的数据
0.00 0.01 0.00 1/271 23741
分别是1分钟负载,五分钟负载,十五分钟负载,运行进程/总进程 最大的pid
只需要采集前五个数据既可得到所有信息
注意:只有当系统负载除cpu核数>1的时候,系统负载较高
traffic
字段含义
- bytin: 入口流量byte/s
- bytout: 出口流量byte/s
- pktin: 入口pkt/s
- pktout: 出口pkt/s
采集方法
流量的计数器信息来自:/proc/net/dev
    face |bytes    packets errs drop fifo frame compressed multicast|bytes    packets errs drop fifo colls carrier compressed
    lo:1291647853895 811582000    0    0    0     0          0         0 1291647853895 811582000    0    0    0     0       0          0
    eth0:853633725380 1122575617    0    0    0     0          0         0 1254282827126 808083790    0    0    0     0       0          0
字段的含义第一行已经标示出来,每一行代表一个网卡,tsar主要采集的是出口和入口的bytes/packets
注意tsar只对以eth和em开头的网卡数据进行了采集,像lo这种网卡直接就忽略掉了,流量的单位是byte
tcp
字段含义
- active:主动打开的tcp连接数目
- pasive:被动打开的tcp连接数目
- iseg: 收到的tcp报文数目
- outseg:发出的tcp报文数目
- EstRes:Number of resets that have occurred at ESTABLISHED
- AtmpFa:Number of failed connection attempts
- CurrEs:当前状态为ESTABLISHED的tcp连接数
- retran:系统的重传率
采集方法
tcp的相关计数器文件是:/proc/net/snmp
    Tcp: RtoAlgorithm RtoMin RtoMax MaxConn ActiveOpens PassiveOpens AttemptFails EstabResets CurrEstab InSegs OutSegs RetransSegs InErrs OutRsts
    Tcp: 1 200 120000 -1 31702170 14416937 935062 772446 16 1846056224 1426620266 448823 0 5387732
我们主要关注其中的ActiveOpens/PassiveOpens/AttemptFails/EstabResets/CurrEstab/InSegs/OutSegs/RetransSegs
主要关注一下重传率的计算方式:
retran = (RetransSegs-last RetransSegs) / (OutSegs-last OutSegs) * 100%
udp
字段含义
- idgm: 收到的udp报文数目
- odgm: 发送的udp报文数目
- noport:udp协议层接收到目的地址或目的端口不存在的数据包
- idmerr:udp层接收到的无效数据包的个数
采集方法
UDP的数据来源文件和TCP一样,也是在/proc/net/snmp
    Udp: InDatagrams NoPorts InErrors OutDatagrams
    Udp: 31609577 10708119 0 159885874
io
字段含义
- rrqms: The number of read requests merged per second that were issued to the device.
- wrqms: The number of write requests merged per second that were issued to the device.
- rs: The number of read requests that were issued to the device per second.
- ws: The number of write requests that were issued to the device per second.
- rsecs: The number of sectors read from the device per second.
- wsecs: The number of sectors written to the device per second.
- rqsize:The average size (in sectors) of the requests that were issued to the device.
- qusize:The average queue length of the requests that were issued to the device.
- await: The average time (in milliseconds) for I/O requests issued to the device to be served. This includes the time spent by the requests in queue and the time spent servicing them.
- svctm: The average service time (in milliseconds) for I/O requests that were issued to the device.
- util: Percentage of CPU time during which I/O requests were issued to the device (bandwidth utilization for the device).Device saturation occurs when this value is close to 100%.
采集方法
IO的计数器文件是:/proc/diskstats,比如:
    202    0 xvda 12645385 1235409 416827071 59607552 193111576 258112651 3679534806 657719704 0 37341324 717325100
    202    1 xvda1 421 2203 3081 9888 155 63 421 1404 0 2608 11292
每一行字段的含义是:
- major: 主设备号
- minor: 次设备号,设备号是用来区分磁盘的类型和厂家信息
- name: 设备名称
- rd_ios: 读完成次数,number of issued reads. This is the total number of reads completed successfully
- rd_merges: 合并读完成次数,为了效率可能会合并相邻的读和写.从而两次4K的读在它最终被处理到磁盘上之前可能会变成一次8K的读,才被计数(和排队),因此只有一次I/O操作
- rd_sectors: 读扇区的次数,number of sectors read. This is the total number of sectors read successfully.
- rd_ticks: 读花费的毫秒数,number of milliseconds spent reading. This is the total number of milliseconds spent by all reads
- wr_ios: 写完成次数,number of writes completed. This is the total number of writes completed successfully
- wr_merges: 合并写完成次数,number of writes merged Reads and writes which are adjacent to each other may be merged for efficiency. Thus two 4K reads may become one 8K read before it is ultimately handed to the disk, and so it will be counted (and queued) as only one I/O.
- wr_sectors: 写扇区次数,number of sectors written. This is the total number of sectors written successfully
- wr_ticks: 写花费的毫秒数,number of milliseconds spent writing. This is the total number of milliseconds spent by all writes.
- cur_ios: 正在处理的输入/输出请求数,number of I/Os currently in progress. The only field that should go to zero. Incremented as requests are given to appropriate request_queue_t and decremented as they finish.
- ticks: 输入/输出操作花费的毫秒数
- aveq: 输入/输出操作花费的加权毫秒数
通过这些计数器可以算出来上面的每个字段的值
double n_ios = rd_ios + wr_ios;
double n_ticks = rd_ticks + wr_ticks;
double n_kbytes = (rd_sectors + wr_sectors) / 2;
st_array[0] = rd_merges / (inter * 1.0);
st_array[1] = wr_merges / (inter * 1.0);
st_array[2] = rd_ios / (inter * 1.0);
st_array[3] = wr_ios / (inter * 1.0);
st_array[4] = rd_sectors / (inter * 2.0);
st_array[5] = wr_sectors / (inter * 2.0);
st_array[6] = n_ios ? n_kbytes / n_ios : 0.0;
st_array[7] = aveq / (inter * 1000);
st_array[8] = n_ios ? n_ticks / n_ios : 0.0;
st_array[9] = n_ios ? ticks / n_ios : 0.0;
st_array[10] = ticks / (inter * 10.0);
注意:
扇区一般都是512字节,因此有的地方除以2了 ws是指真正落到io设备上的写次数, wrqpms是指系统调用合并的写次数, 它们之间的大小关系没有可比性,因为不知道多少请求能够被合并,比如发起了100个read系统调用,每个读4K,假如这100个都是连续的读,由于硬盘通常允许最大的request为256KB,那么block层会把这100个读请求合并成2个request,一个256KB,另一个144KB,rrqpm/s为100,因为100个request都发生了合并,不管它最后合并成几个;r/s为2,因为最后的request数为2
paritition
字段含义
- bfree: 分区空闲的字节
- bused: 分区使用中的字节
- btotl: 分区总的大小
- util: 分区使用率
采集方法
首先通过/etc/mtab获取到分区信息,然后通过statfs访问该分区的信息,查询文件系统相关信息,包含:
    struct statfs {
    long f_type;
    long f_bsiz
    e;
    long f_blocks;
    long f_bfree;
    long f_bavail;
    long f_files;
    long f_ffree;
    fsid_t f_fsid;
    long f_namelen;
    };
然后就可以计算出tsar需要的信息,分区的字节数=块数*块大小=f_blocks * f_bsize
pcsw
字段含义
- cswch: 进程切换次数
- proc: 新建的进程数
采集方法
计数器在/proc/stat:
    ctxt 19873315174
    processes 296444211
分别代表进程切换次数,以及进程数
tcpx
字段含义
recvq sendq est twait fwait1 fwait2 lisq lising lisove cnest ndrop edrop rdrop pdrop kdrop
分别代表
tcprecvq tcpsendq tcpest tcptimewait tcpfinwait1 tcpfinwait2 tcplistenq tcplistenincq tcplistenover tcpnconnest tcpnconndrop tcpembdrop tcprexmitdrop tcppersistdrop tcpkadrop
采集方法
计数器来自:/proc/net/netstat /proc/net/snmp 里面用到的数据有:
TcpExt: SyncookiesSent SyncookiesRecv SyncookiesFailed EmbryonicRsts PruneCalled RcvPruned OfoPruned OutOfWindowIcmps LockDroppedIcmps ArpFilter TW TWRecycled TWKilled PAWSPassive PAWSActive PAWSEstab DelayedACKs DelayedACKLocked DelayedACKLost ListenOverflows ListenDrops TCPPrequeued TCPDirectCopyFromBacklog具体字段找到并且获取即可
percpu ncpu
字段含义
字段含义等同cpu模块,只不过能够支持采集具体的每一个cpu的信息
采集方法
等同于cpu模块
pernic
字段含义
字段含义等同traffic模块,只不过能够支持采集具体的每一个网卡的信息
采集方法
等同于traffic模块
应用模块
proc
字段含义
- user: 某个进程用户态cpu消耗
- sys: 某个进程系统态cpu消耗
- total:某个进程总的cpu消耗
- mem: 某个进程的内存消耗百分比
- RSS: 某个进程的虚拟内存消耗,这是驻留在物理内存的一部分.它没有交换到硬盘.它包括代码,数据和栈
- read: 进程io读字节
- write:进程的io写字节
采集方法
计数器文件
/proc/pid/stat:获取进程的cpu信息
/proc/pid/status:获取进程的mem信息
/proc/pid/io:获取进程的读写IO信息
注意,需要将采集的进程名称配置在/etc/tsar/tsar.conf总的mod_proc on procname,这样就会找到procname的pid,并进行数据采集
nginx
字段含义
- Accept:总共接收的新连接数目
- Handle:总共处理的连接数目
- Reqs:总共产生请求数目
- Active:活跃的连接数,等于read+write+wait
- Read:读取请求数据的连接数目
- Write:向用户写响应数据的连接数目
- Wait:长连接等待的连接数目
- Qps:每秒处理的请求数
- Rt:平均响应时间ms
采集方法
通过nginx的采集模块配置,访问特定地址,具体参见:https://github.com/taobao/tsar-mod_nginx
    location = /nginx_status {
        stub_status on;
    }
请求到的数据是:
    Active connections: 1
    server accepts handled requests request_time
    24 24 7 0
    Reading: 0 Writing: 1 Waiting: 0
需要确保nginx配置该location,并且能够访问curl http://localhost/nginx_status得到上面的数据
如果nginx的端口不是80,则需要在配置文件中指定端口,配置文件是/etc/tsar/tsar.conf,修改mod_nginx on为mod_nginx on 8080
类似的有nginx_code, nginx_domain模块,相应的配置是:
    req_status_zone server "$host" 20M;
    req_status server;
    location /traffic_status {
            req_status_show;
    }
通过访问curl http://localhost/traffic_status能够得到如下字段的数据
localhost,0,0,2,2,2,0,0,0,0,0,0,0,0,2,0,0,0,0,0,0,0,0,0,0,0,0,0
请求到的数据每个字段的含义是:
- kv 计算得到的req_status_zone指令定义变量的值,此时为domain字段
- bytes_in_total 从客户端接收流量总和
- bytes_out_total 发送到客户端流量总和
- conn_total 处理过的连接总数
- req_total 处理过的总请求数
- 2xx 2xx请求的总数
- 3xx 3xx请求的总数
- 4xx 4xx请求的总数
- 5xx 5xx请求的总数
- other 其他请求的总数
- rt_total rt的总数
- upstream_req 需要访问upstream的请求总数
- upstream_rt 访问upstream的总rt
- upstream_tries upstram总访问次数
- 200 200请求的总数
- 206 206请求的总数
- 302 302请求的总数
- 304 304请求的总数
- 403 403请求的总数
- 404 404请求的总数
- 416 416请求的总数
- 499 499请求的总数
- 500 500请求的总数
- 502 502请求的总数
- 503 503请求的总数
- 504 504请求的总数
- 508 508请求的总数
- detail_other 非以上13种status code的请求总数
如果domain数量太多,或者端口不是80,需要进行专门的配置,配置文件内容如下:
port=8080 #指定nginx的端口
top=10 #指定最多采集的域名个数,按照请求总个数排列
domain=a.com b.com #指定特定需要采集的域名列表,分隔符为空格,逗号,或者制表符
在/etc/tsar/tsar.conf中指定配置文件的路径:mod_nginx_domain on /tmp/my.conf
squid
字段含义
- qps: 每秒请求数
- rt: 访问平均相应时间
- r_hit: 请求命中率
- b_hit: 字节命中率
- d_hit: 磁盘命中率
- m_hit: 内存命中率
- fdused: Number of file desc currently in use
- fdque: Files queued for open
- objs: StoreEntries
- inmem: StoreEntries with MemObjects
- hot: Hot Object Cache Items
- size: Mean Object Size
采集方法
访问squid的mgrinfo信息获取,有些字段经过了一些patch,可能不适用外部版本
haproxy
字段含义
- stat: 状态,1正常
- uptime:启动持续时间
- conns: 总的连接数
- qps: 每秒请求数
- hit: haproxy开启cache时的命中率
- rt: 平均响应时间ms
采集方法
haproxy经过了patch,能够在多进程模式下进行统计信息的汇总,然后通过haproxy的本地访问其状态页面admin分析得到
lvs
字段含义
- stat: lvs状态,1正常
- conns: 总的连接数
- pktin: 收到的包数
- pktout:发出的包数
- bytin: 收到的字节数
- bytout:发出的字节数
采集方法
访问lvs的统计文件:/proc/net/ip_vs_stats
apache
参见:https://github.com/kongjian/tsar-apache
tcprt
私有应用,略
swift
私有应用,略
cgcpu/cgmem/cgblkio
私有应用,略
trafficserver
待补充
tmd
私有应用,略


 2254
2254

 被折叠的 条评论
为什么被折叠?
被折叠的 条评论
为什么被折叠?
 到【灌水乐园】发言


