


有时候通过./jmap -heap [pid] 命令发现JVM堆内存使用900M,某个时刻显示新生代和老年代的使用之和600M,本想看看600M是什么对象占的,通过jmap dump生成dump文件后,发现used 内存占比比较小,只有200M, free内存占比很高,很奇怪。经过官网文档,发现了端倪。
参考MAT官网资料 Unreachable objects
Find out more about objects that could or should be garbage collected.
Motivation
Sometimes a heap dump contains objects which would be removed at the next garbage collection. These are objects which are unreachable from the garbage collection roots. By default, Memory Analyzer removes these objects as part of the parse process as normally they are not important in determining a memory leak. If the heap dump is generated as a result of an OutOfMemoryError then the Java virtual machine will usually have performed a garbage collection operation to attempt to free space for the new object, so there will not be those objects in the heap dump file. There is a chance that the garbage collection was not performed, for example if the object to be allocated was so huge that it was obvious to the JVM that no amount of garbage collection could free enough space, or if the heap dump was triggered by another event.
Sometimes however, it is interesting to investigate these unreachable objects. For example if the application is spending a lot of time garbage collecting then it may be allocating and discarding more objects than is sensible. The types of the objects which could be discarded at the next garbage collection gives a clue as to which temporary objects the application is causing to be allocated. When acquiring a heap dump for this purpose using the Memory Analyzer, do not use the live=true option as that would discard unreachable objects before the heap dump is generated.
【翻译】有时堆转储包含将在下一次垃圾回收时删除的对象。这些是从垃圾回收根目录无法访问的对象。默认情况下,内存分析器会在解析过程中删除这些对象,因为通常它们对于确定内存泄漏并不重要。如果堆转储是由于OutOfMemoryError生成的,则Java虚拟机通常会执行垃圾回收操作以尝试为新对象释放空间,因此堆转储文件中不会包含那些对象。有可能不执行垃圾回收,例如,如果要分配的对象太大,以至于JVM很明显,没有大量的垃圾回收可以释放足够的空间,或者堆转储是由另一个触发的事件。
但是有时候,研究这些无法访问的对象很有趣。例如,如果应用程序花费大量时间进行垃圾回收,那么它可能分配和丢弃的对象超出了合理的范围。可以在下一次垃圾回收时丢弃的对象类型提供了有关导致应用程序分配哪些临时对象的线索。为此,使用内存分析器为此目的获取堆转储时,请勿使用live = true选项,因为这会在生成堆转储之前丢弃无法访问的对象。
简单来说就是某个时刻,此时堆占用600M,但是其中有400M的内存属于可以清理的垃圾,当下次回收时会被删除掉,在生成dump日志时,系统认为这部分对象会影响用户判断内存占用,故而会提前触发一次垃圾回收,这样只保留200M真正活在内存中的对象。
Arguments
None
Invoke using either:
From the link on the Overview page
From the Query Browser via Java Basics > Unreachable Objects
预览界面,有个链接,可以进入Unreachable_objects界面
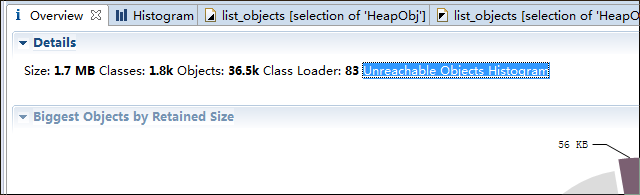 图一
图一
Result
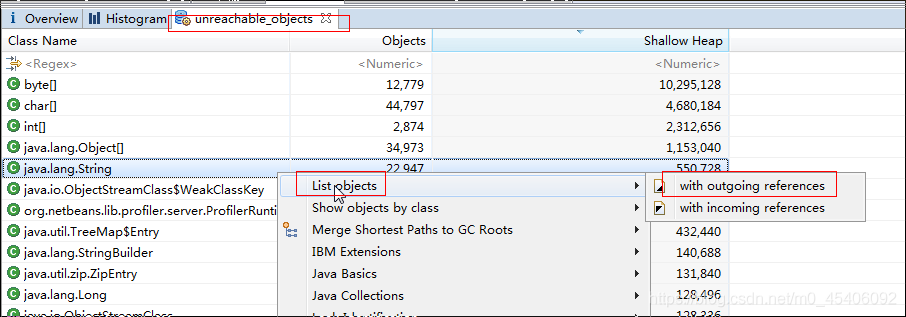
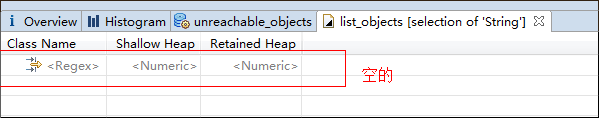
The result is a histogram table showing the class names and number of object instances of the unreachable objects, together with their total sizes. This histogram has no object graph behind it (unreachable objects are removed during the parsing of the heap dump, only class names are stored). Thus it is not possible to see e.g. a list of references for a particular unreachable object
结果是一个直方图表,显示了不可访问对象的类名称和对象实例数,以及它们的总大小。 该直方图后面没有对象图(无法解析的对象在堆转储的解析过程中被删除,仅存储了类名)。 因此,不可能看到例如 特定不可访问对象的引用列表


 1万+
1万+


 被折叠的 条评论
为什么被折叠?
被折叠的 条评论
为什么被折叠?
 到【灌水乐园】发言


