


一、背景介绍
公司需要监控交换机和IP设备,能够放在展示屏幕,及时发出告警信息。网上有很多监控软件,prometheus系列已经能够满足我们需求。prometheus功能强大,本次只用到一部功能。咱们先把基本的部署安装好,后续各种参数,还需要继续去研究。唯一不好的是,需要配置很多命令,对初学者和非技术人员,存在一定门槛,但这也形成比较高的自由度。
二、部署环境
服务器:
12核32G
操作系统
CentOS Linux release 7.6
注意点
建议部署前,关闭系统防火墙,后期调试完毕,再添加放行端口。
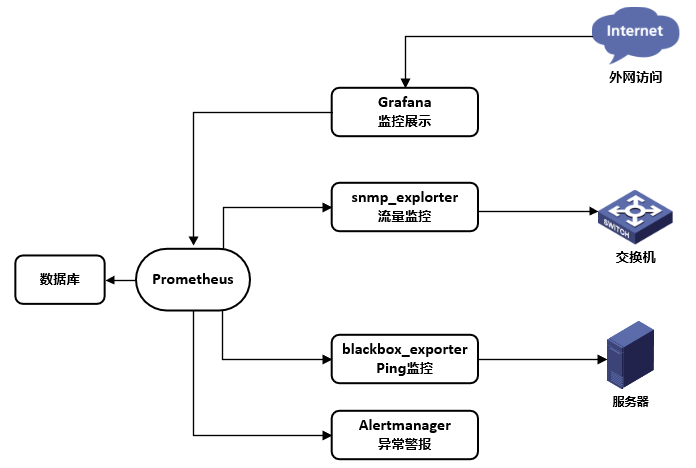
三、结构图
Grafana作为展示界面,Prometheus作为核心,调用snmp_explorter和blackbox_explorter监控模块,使用Alertmanager作为报警模块,形成一个完整的结构。
四、部署步骤
1、prometheus
下载安装包
wget https://github.com/prometheus/prometheus/releases/download/v2.37.0/prometheus-2.37.0.linux-amd64.tar.gz
解压安装文件
tar -xf prometheus-2.37.0.linux-amd64.tar.gz
新建用户组
groupadd -r prometheus
新建用户加入组
useradd -r -g prometheus -d / -s /sbin/nologin -c "prometheus user" prometheus
创建目录
mkdir /etc/prometheus
mkdir /home/prometheus
迁移文件夹
cp prometheus-2.37.0.linux-amd64/prometheus /usr/local/bin/
迁移配置文件夹
cp prometheus-2.37.0.linux-amd64/prometheus.yml /etc/prometheus/
赋予权限
chown -R prometheus:prometheus /etc/prometheus
chown -R prometheus:prometheus /home/prometheus/
创建启动脚本
vi /usr/lib/systemd/system/prometheus.service
[Unit]
Description=prometheus
After=network.target
[Service]
Type=simple
User=prometheus
ExecStart=/usr/local/bin/prometheus \
--config.file=/etc/prometheus/prometheus.yml \
--storage.tsdb.path=/home/prometheus \
--storage.tsdb.retention=15d \
--web.read-timeout=5m \
--web.max-connections=10 \
--query.max-concurrency=20 \
--query.timeout=2m \
--web.enable-lifecycle
Restart=on-failure
[Install]
WantedBy=multi-user.target
调试命令
systemctl enable prometheus
systemctl start prometheus
systemctl restart prometheus
systemctl status prometheus
检查服务是否启动
netstat -anlptu|grep :9090
tcp6 0 0 ::1:49954 ::1:9090 ESTABLISHED 16429/prometheus
验证
打开设备ip端口
http://192.168.0.212:9090
2、grafana
Grafana作为展示平台
下载安装
wget https://dl.grafana.com/enterprise/release/grafana-enterprise-9.0.6-1.x86_64.rpm
sudo yum install grafana-enterprise-9.0.6-1
 最低0.47元/天 解锁文章


 2128
2128


 被折叠的 条评论
为什么被折叠?
被折叠的 条评论
为什么被折叠?
 到【灌水乐园】发言


