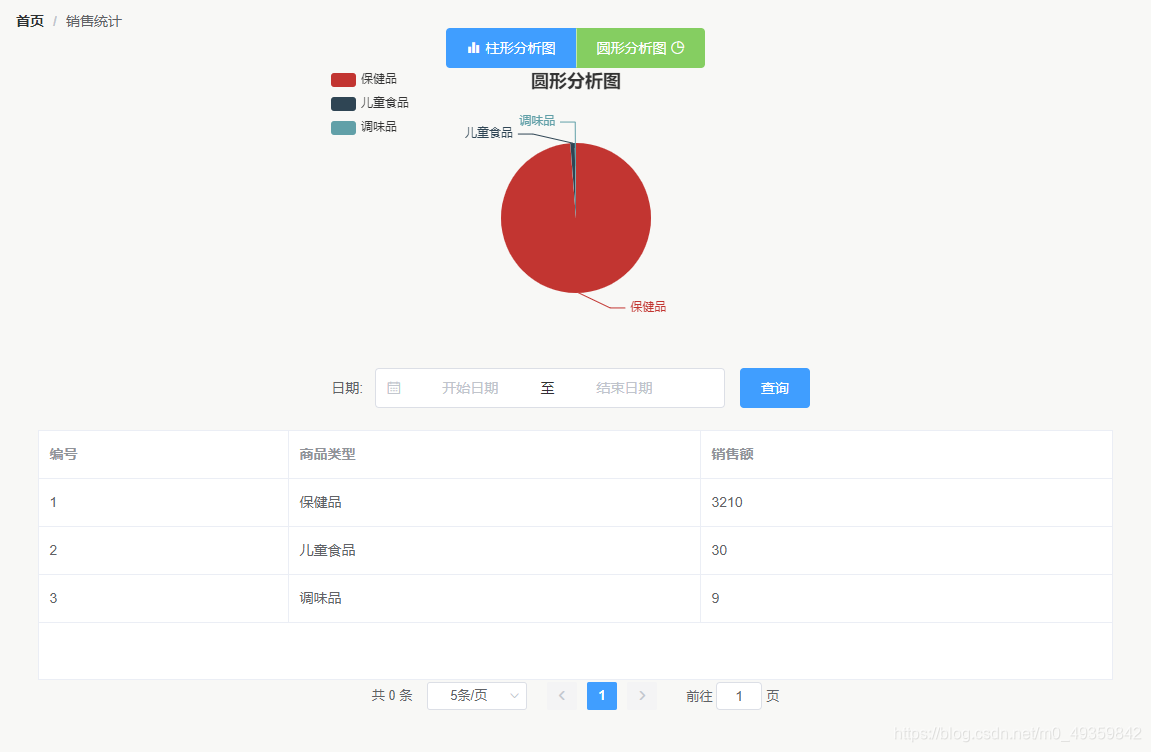
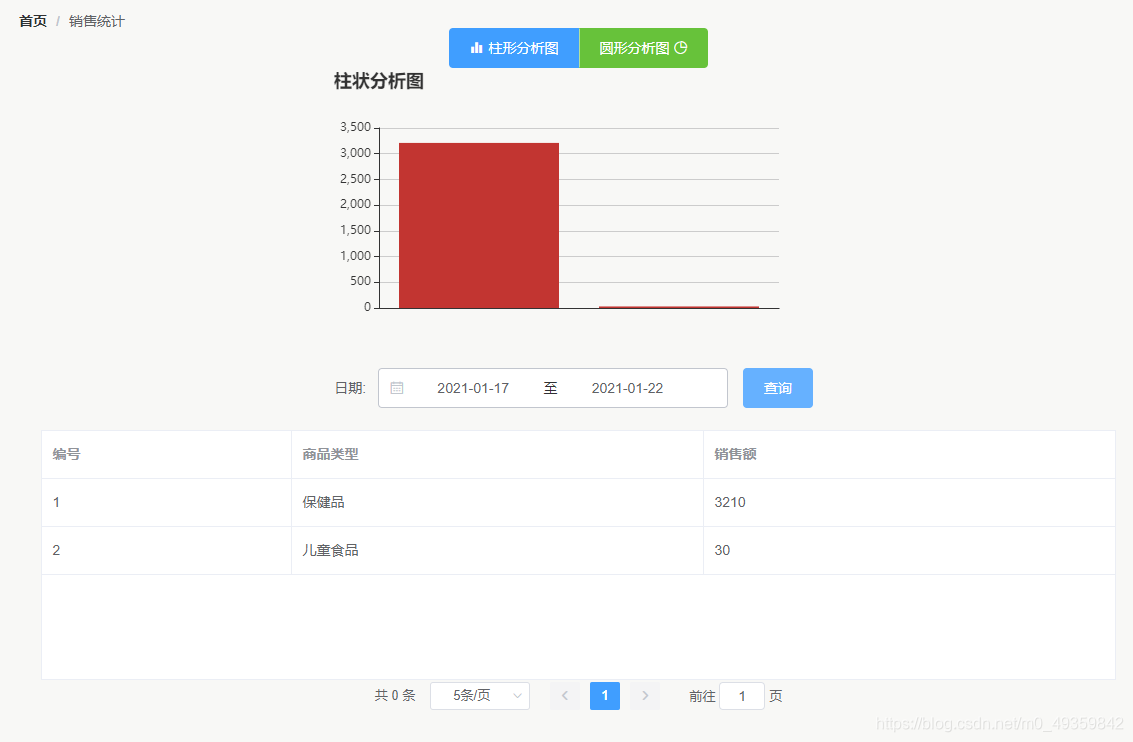
效果如下:
1、导入echarts组件,建议使用4.9.0版本,5.0.1可能会报错
npm uninstall echarts
npm install echarts@4.9.0
2、引入echarts组件,可以在main.js中引入
import echarts from 'echarts'
Vue.prototype.$echarts = echarts
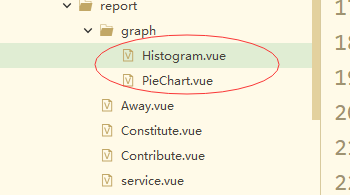
3、单独把echarts的图表写出来
4、写echarts组件
柱状分析图
<template>
  <div ref="chart" class="container"></div>
</template>

<script>
  export default {
    data: function() {
      return {};
    },
    methods: {
      initChart() {
        let myChart = this.$echarts.init(this.$refs.chart);
        myChart.setOption({
          title: {
            text: '柱状分析图'
          },
          tooltip: {},
          xAxis: {
            type: 'category',
            data: this.keyData,
          },
          yAxis: {
            type: 'value',
          },
          series: [{
            data: this.valueData,
            type: 'bar'
          }]

        })
      }

    },
    computed: {
      keyData: function() {

        return this.$store.getters.getKeyData;

      },
      valueData: function() {
        return this.$store.getters.getValueData;
      }

    },


    mounted() {
      this.initChart();
    },

  }
</script>


<style>
  .container {
    width: 500px;
    height: 300px;
  }
</style>
饼状图
<template>
  <div ref="chart" class="container"></div>
</template>

<script>
  export default {
    data: function() {
      return {};
    },
    methods: {
      initChart() {
        let myChart = this.$echarts.init(this.$refs.chart);
        myChart.setOption({
          title: {
            text: '圆形分析图',
            subtext: '',
            left: 'center'
          },
          tooltip: {
            trigger: 'item',
            formatter: '{a} <br/>{b} : {c} ({d}%)'
          },
          legend: {
            orient: 'vertical',
            left: 'left',
          },
          series: [{
            name: '访问来源',
            type: 'pie',
            radius: '50%',
            data: this.pieData,
            emphasis: {
              itemStyle: {
                shadowBlur: 10,
                shadowOffsetX: 0,
                shadowColor: 'rgba(0, 0, 0, 0.5)'
              }
            }
          }]
        })
      }

    },
    computed:{
      pieData:function(){
        return this.$store.getters.getPieData;
      }
    },
    mounted() {
      this.initChart();
    }
  }
</script>

<style>
  .container {
    width: 500px;
    height: 300px;
  }
</style>
5、在需要的地方引入图表组件
<template>
<!--客户流失-->
<div>
<!--面包屑-->
<el-breadcrumb separator="/">
<el-breadcrumb-item :to="{ path: '/hello' }">首页</el-breadcrumb-item>
<el-breadcrumb-item>销售统计</el-breadcrumb-item>
</el-breadcrumb>
<!--按钮-->
<div align="center" class="div-button">
<el-button-group>
<el-button type="primary" icon="el-icon-s-data" @click="cutColumnar">柱形分析图</el-button>
<el-button type="success" @click="cutRound">圆形分析图 <i class="el-icon-pie-chart"></i></el-button>
</el-button-group>
</div>
<!--分析图-->
<div align="center" class="div-analysis">
<Histogram v-show="columnar" v-if="isRouterAlive"></Histogram>
<PieChart v-show="round" v-if="isRouterAlive"></PieChart>
<div v-if="!isRouterAlive">
<br>
<br>
<br>
<h1>暂无数据</h1>
<br>
<br>
<br>
</div>
</div>
<!--表单按钮组-->
<div align="center" class="div-button">
<el-form :inline="true" :model="formInline" class="demo-form-inline">
<el-form-item label="日期:">
<el-date-picker v-model="formInline.ataDate" type="daterange" format="yyyy-MM-dd" value-format="yyyy-MM-dd"
align="right" unlink-panels range-separator="至" start-placeholder="开始日期" end-placeholder="结束日期">
</el-date-picker>
</el-form-item>
<el-form-item>
<el-button type="primary" @click="onSubmit(1)">查询</el-button>
</el-form-item>
</el-form>
</div>
<!--表格-->
<div align="center">
<template>
<el-table :data="tableData" height="250" border style="width: 96%">
<el-table-column type="index" label="编号" width="250" :index="indexMethod">
</el-table-column>
</el-table-column>
<el-table-column prop="tName" label="商品类型">
</el-table-column>
<el-table-column prop="sumPrice" label="销售额">
</el-table-column>
</el-table>
</template>
<!--分页组件-->
<div class="div-pagination">
<el-pagination background @size-change="handleSizeChange" @current-change="handleCurrentChange" :current-page="page"
:page-sizes="[5, 10]" :page-size="rows" layout="total, sizes, prev, pager, next, jumper" :total="total">
</el-pagination>
</div>
</div>
<router-view>
</router-view>
</div>
</template>
<script>
import Histogram from '@/views/statistic/graph/Histogram.vue'
import PieChart from '@/views/statistic/graph/PieChart.vue'
export default {
data: function() {
return {
columnar: true,
round: false,
formInline: {
ataDate: '',
},
tableData: null,
isRouterAlive: true,
page: 1,
rows: 5,
total: 0,
}
},
components: {
Histogram,
PieChart
},
methods: {
indexMethod: function(index) {
return (this.page - 1) * this.rows + (index + 1);
},
cutColumnar: function() {
this.columnar = true;
this.round = false;
},
cutRound: function() {
this.round = true;
this.columnar = false;
},
handleSizeChange: function(rows) {
this.page = 1;
this.rows = rows;
this.query();
},
handleCurrentChange: function(page) {
this.page = page;
this.query();
},
onSubmit: function(page) {
this.page = page;
this.query();
},
query: function() {
let url = this.axios.urls.STATISTIC_QUERYSALES;
if(this.formInline.ataDate==null){
this.formInline.ataDate="";
}
let primarys = {
startTime: this.formInline.ataDate[0],
endTime: this.formInline.ataDate[1],
page: this.page,
rows: this.rows,
}
this.axios.post(url, primarys).then(resp => {
let json = resp.data;
if (json.status == 200) {
let arr = json.data;
this.tableData = arr;
let keyData = [];
let valueData = [];
let pieData = [];
for (let i = 0; i < arr.length; i++) {
keyData.push(arr[i].tName);
valueData.push(arr[i].sumPrice);
pieData.push({
value: arr[i].sumPrice,
name: arr[i].tName
});
}
this.$store.commit('setKeyData', {
keyData: keyData,
});
this.$store.commit('setValueData', {
valueData: valueData,
});
this.$store.commit('setPieData', {
pieData: pieData,
});
} else {
this.tableData = null;
}
})
}
},
watch: {
tableData(searchWord, retWord) {
if (searchWord == null) {
this.isRouterAlive = false
} else {
this.isRouterAlive = false
this.$nextTick(() => (this.isRouterAlive = true))
}
}
},
created: function() {
this.query();
}
}
</script>
以上给大家一个动态实现统计报表的思路,这样做的好处是一个图表可以用在多个页面中,只需要做参数上的处理就可以,其他的图表可以依照这个思路参考


 2097
2097


 被折叠的 条评论
为什么被折叠?
被折叠的 条评论
为什么被折叠?
 到【灌水乐园】发言


